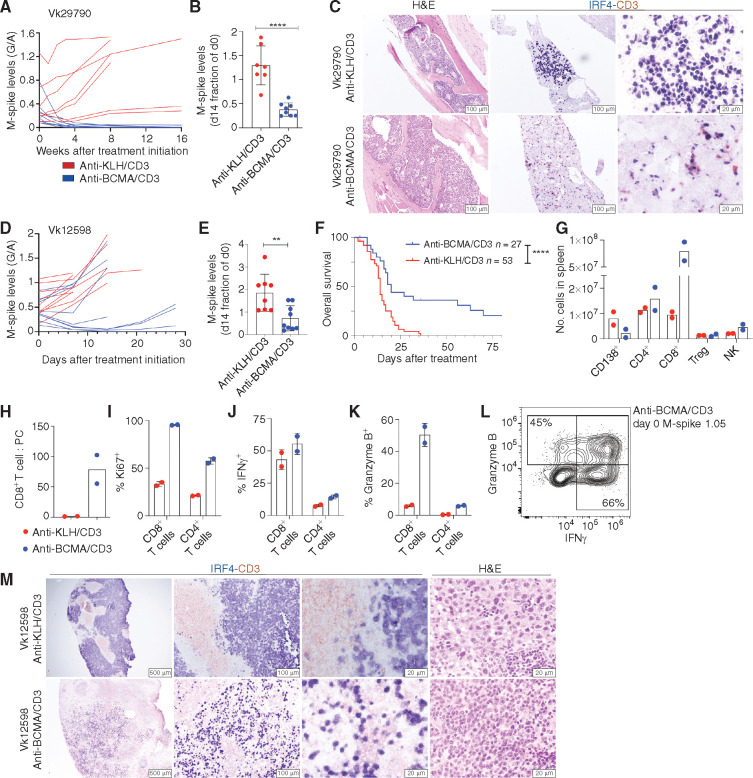
Figure 2.
The activity of anti-BCMA/CD3 is transient and related to initial tumor burden. A, M-spike levels (G/A ratio) measured over time in Vk29790 tumor–bearing mice treated with control anti-KLH/CD3 BsAb or anti-BCMA/CD3 at 1 mg/kg on days 1 and 8. B, M-spike levels (% of day 0) in Vk29790 tumor–bearing mice measured 14 days after treatment. Each dot represents an M-spike from an individual mouse. Bars show mean M-spike levels with SD. C, IHC staining (surface CD3 in red and nuclear IRF4 in blue) of BM sections from mice treated in A. Scale bar is shown in the bottom right corner. Images are representative of two mice necropsied from each treatment arm. H&E, hematoxylin and eosin. D, M-spike levels (G/A) quantified over time in response to control anti-KLH/CD3 or anti-BCMA/CD3 BsAb given at 1 mg/kg on days 1 and 8 in Vk12598 tumor–bearing mice. E, M-spike levels (% of day 0) in Vk12598 tumor–bearing mice measured 14 days after treatment. F, Kaplan–Meier survival plot in days from the initiation of treatment of Vk12598 tumor–bearing mice receiving the BsAb or control treatment. P values derived from Mantel–Cox log-ranked X2 test. G–L, FCM analysis of splenocytes from Vk12598 tumor–bearing mice harvested 3 days after treatment initiation as in D. NK, natural killer. M, Representative CD3 and IRF4 staining by IHC of SPL sections harvested 3 days after treatment initiation as in D. Unpaired t test P values in B and E are represented by asterisks. *, P < 0.05; **, P < 0.01; ***, P < 0.001; ****, P < 0.0001.

