Figure 5.
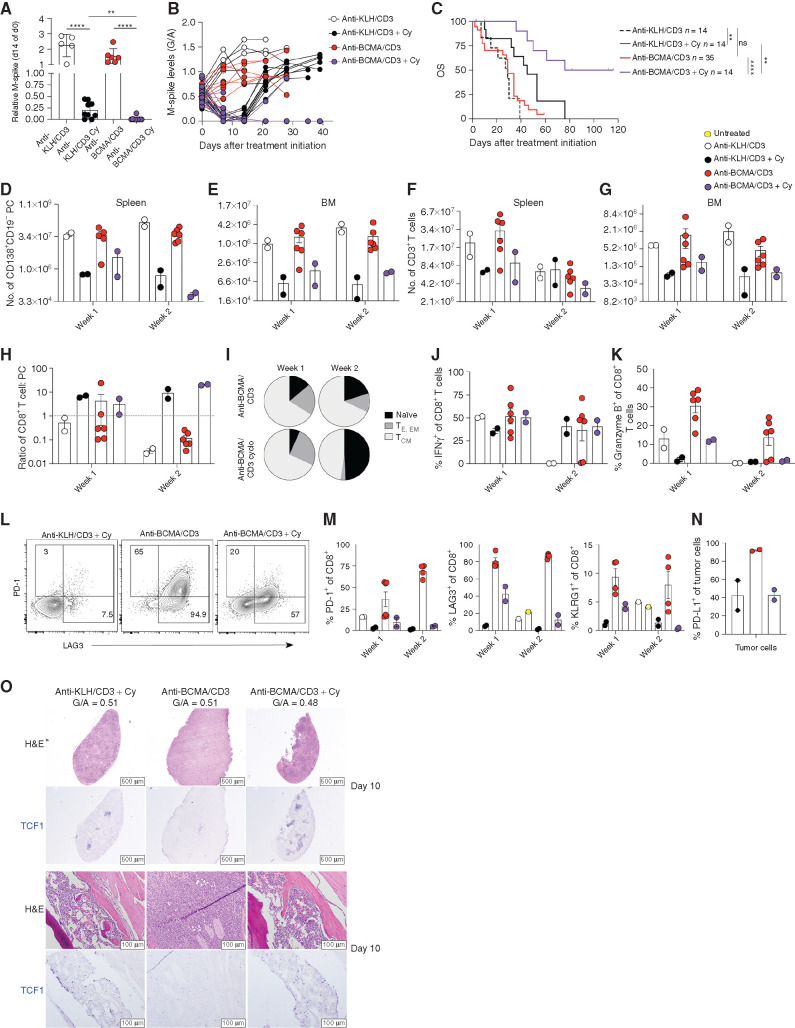
Effective combination of Cy and anti-BCMA/CD3. hC343 mice bearing Vk32908 multiple myeloma cells were treated with anti-KLH/CD3 BsAb or anti-BCMA/CD3 BsAb (1 mg/kg on days 1 and 8) with or without Cy concurrently (100 mg/kg on days 1 and 8). A, M-spike levels (% of day 0) measured 14 days after treatment. Each dot represents an M-spike from an individual mouse. Bars show mean M-spike levels with SD. Unpaired t test: *, P < 0.05; **, P < 0.01; ***, P < 0.001; ****, P < 0.0001. ns, not significant. B, M-spike levels (G/A) measured weekly for the treatment groups in A. Each dot represents an individual mouse. C, Kaplan–Meier survival plot in days of Vk32908 tumor–bearing mice receiving treatments in A; P values derived from Mantel–Cox log-rank X2 test. Number of tumor cells (D and E) or T cells (F and G) quantified by FCM in the SPL or BM of mice 3 or 10 days after treatment initiation. Each dot represents an individual mouse. H, CD8+ T cell–to–tumor cell ratio in the SPL. I, Average frequency of CD8+ T-cell memory compartments quantified by FCM [naïve = CD44−CD62L+, effector (TE) = CD44+CD62L−KLRG1− or CD44+CD62L−KLRG1+, effector memory (TM) = CD44+CD62L−, and central memory (TCM) = CD44+CD62L+]. Bar graphs of the frequency of splenic CD8+ T cells expressing IFNγ (J) or granzyme B (K). L, Example dot plots of CD8+ T-cell expression of immediate activation markers LAG3 and PD-1 3 days after treatments indicated on top of each graph. M, Percentage of splenic CD8+ T cells expressing PD-1, LAG3, and KLRG1. N, Percentage of Vk32908 tumor cells expressing PD-L1 10 days after treatment initiation. O, Hematoxylin and eosin (H&E) and TCF1 (blue) staining of SPL (top) and BM (bottom) sections from mice collected 10 days after treatment with the indicated drugs. M-spike levels (G/A) at day 0 are reported for each mouse.

