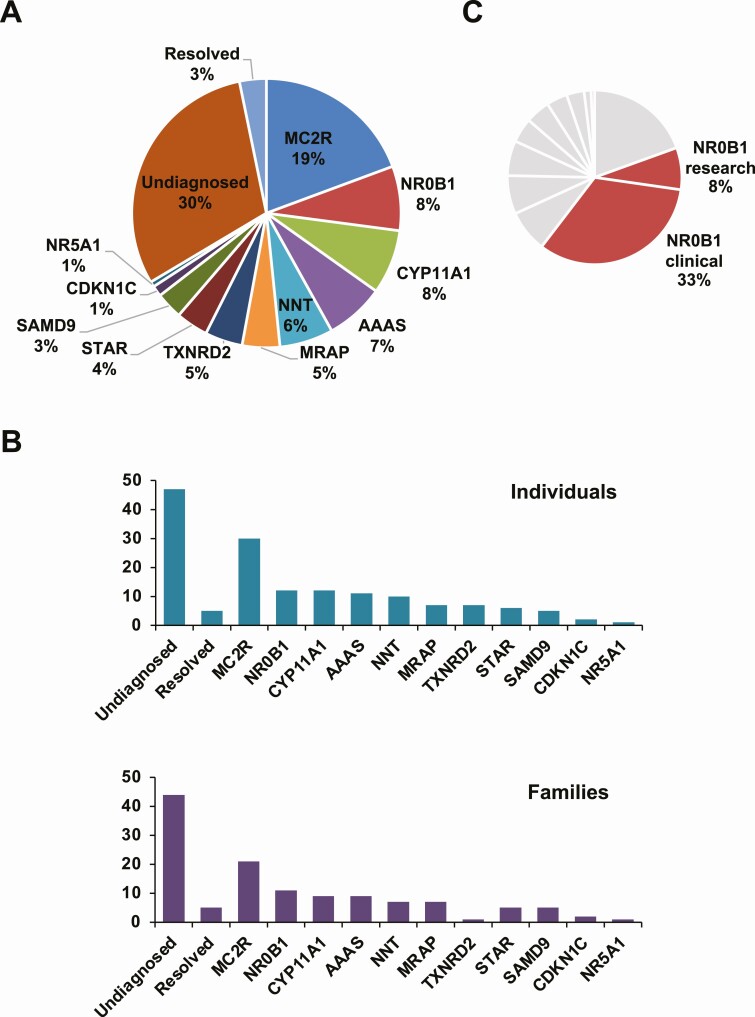
Figure 1.
Overview of the study cohort and genetic diagnoses reached. (A) Relative percentages of each diagnosis for the research cohort in relation to undiagnosed and resolved categories (n = 155). (B) Numbers of individuals (n = 155) with each genetic diagnosis (upper panel) and number of different affected families (n = 127) (lower panel). Note: data for X-linked adrenal hypoplasia (DAX-1/NR0B1) identified through clinical services not included here. (C) Relative percentages of NR0B1 diagnoses (research and clinical) (combined n = 63) in relation to all diagnosed individuals (n = 154). Data represent the number of individuals, not families.

