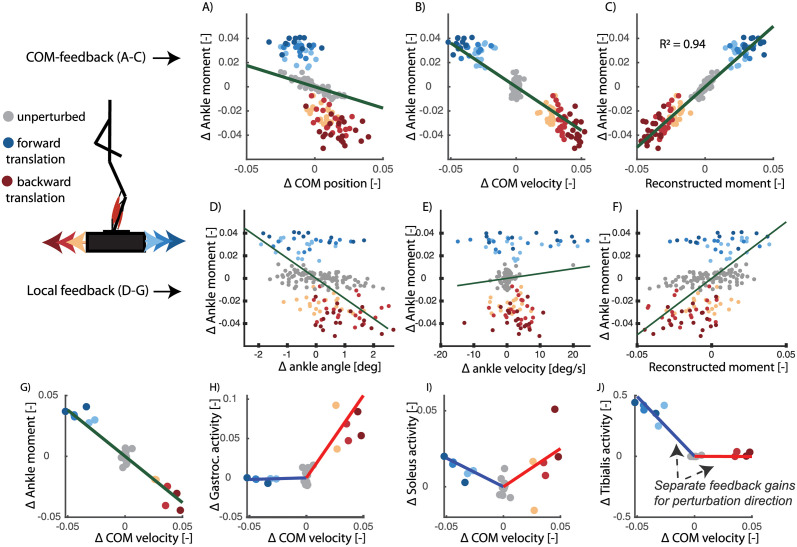
Fig 3. Perturbed standing (data from [26]).
Here we show the relation between COM kinematics and ankle moment (A-C) and the relation between ankle kinematics and ankle moment (D-F) 150ms after perturbation onset. Each dot represents a single perturbation trial with a platform translation in forward (blue) or backward (red) direction with different magnitudes (color tint). A feedback model based on delayed COM position (A) and velocity (B) feedback can explain 94% of the variance in ankle moment (C) in response to support surface translations in forward and backward directions of different magnitudes. The linear feedback model based on angle angle (D) and angular velocity (E) explained only 21% of the variance in ankle moment (F). When analysing the data for each subject individually in the COM feedback model(G-J), we found that gastrocnemius and soleus activity increased with forward COM velocity and tibialis anterior activity increased with backward COM velocity. Each dot in graphs (G-J) represents a single perturbation trial of a selected subject. Note that the electromyography data was analysed for individual subjects instead of pooled over all subjects due to the limitations related to normalizing electromyography data.

