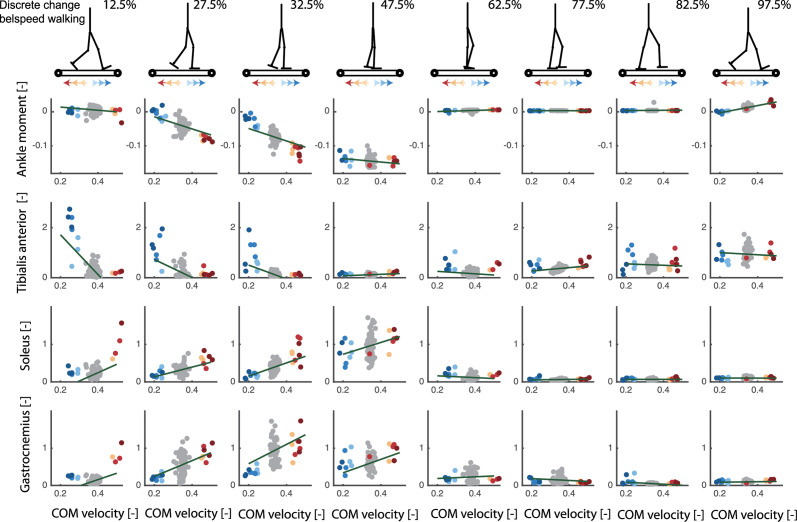
Fig 6. Discrete treadmill perturbations walking (data from [17]).
Representative example of the relation between deviations in delayed center of mass velocity and reactive joint moments (row 1) and activity of the tibialis anterior (row 2), soleus (row 3) and gastrocnemius (row 4) in response to perturbations during walking. Perturbations were applied at four instances during the stance phase of the left leg resulting in eight responses at joint level when combining data of the left and right leg (e.g. right leg is in swing during mid-stance of the left leg). Unperturbed walking is visualised in gray, increases in belt speed (i.e. forward fall) in red and decrease in belt speed in blue (i.e. backward fall). Note that the total joint moment and muscle activity rather than the deviation from the average unperturbed data is shown here to also provide information on the muscle activity and joint moments during unperturbed walking.

