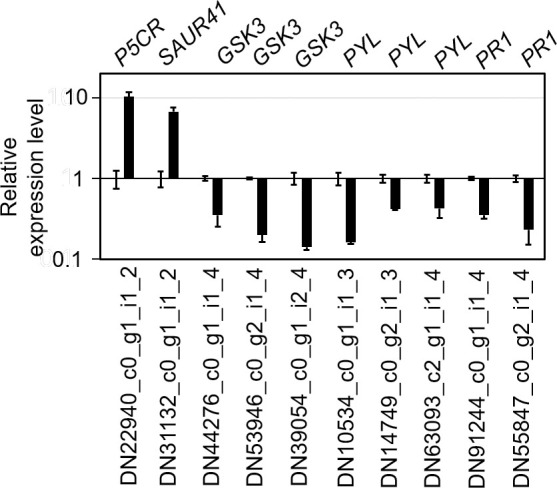
Fig 9. qRT-PCR validation of the RNA-seq results.

Control group was set as 1, and the black column represented the relative expression of DEGs in the graphene-treated group.

Control group was set as 1, and the black column represented the relative expression of DEGs in the graphene-treated group.