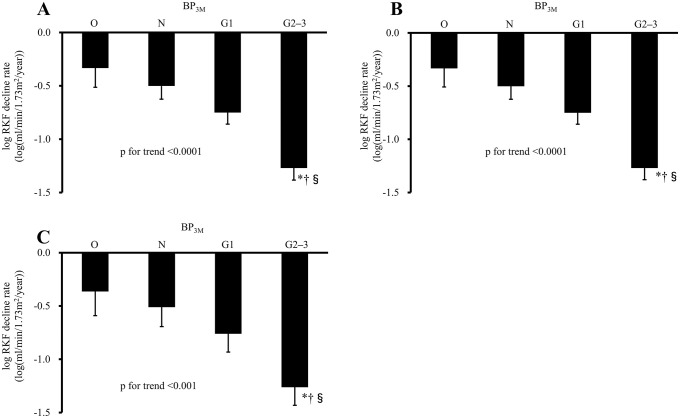
Fig 2. The decline rate of log RKF according to the graded BP3M groups.
A: The unadjusted decline rate of log RKF among the BP3M groups. B: The sex- and age-adjusted decline rate of log RKF among the BP3M groups. C: The multivariable-adjusted decline rate of log RKF among the BP3M groups. *p<0.01 vs. O, †p<0.01 vs. N, §p <0.05 vs. G1. Adjusted covariates are as in Fig 1. Error bars indicate the standard error. Abbreviations are explained in the Fig 1 legend.

