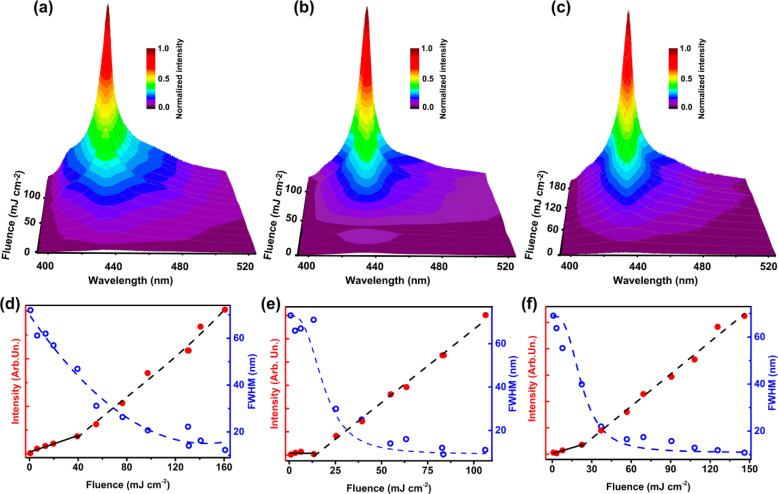
Figure 3.
3D emission intensity maps showing the spectra of (a) CNC/SB-1, (b) CNC/SB-2, and (c) CNC/SB-3 as a function of incident excitation fluence, respectively. (d) Light-out vs light-in curve (full red dots, left axis) of CNC/SB-1, showing a smooth transition upon increasing the excitation fluence, indicating amplified spontaneous emission. The decrease of the emission spectral line-width, which is calculated as the full width at half-maximum (FWHM) of the spectra, upon increasing the excitation fluence (empty blue dots, right axis), is also shown. (e,f) Light-out vs light-in plot (full red dots, left axis) of CNC/SB-2 and CNC/SB-3 film and a decrease of FWHM upon increasing the excitation fluence (empty blue dots, right axis), indicating the laser emission. The black dashed and continuous lines are fit to the data above and below the lasing threshold, respectively. The blue dashed lines are guides for the eyes.

