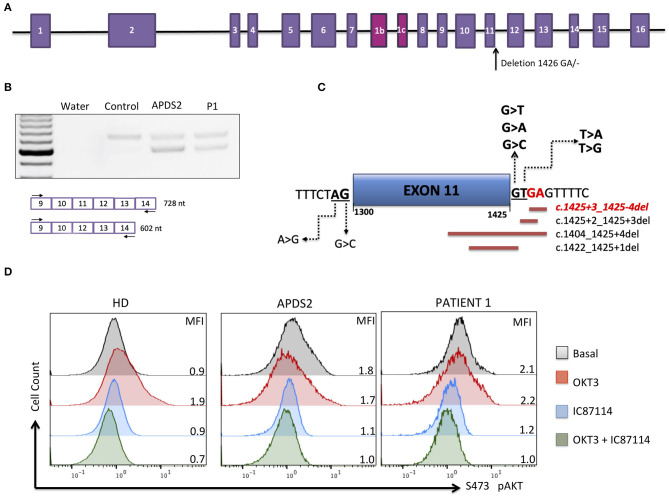
Figure 1.
Molecular APDS2 characteristics. (A) Schematic representation of the PIK3R1 gene and illustrated localization of identified mutation. (B) RT-PCR of PIK3R1 mRNA from T-cell blast of a control, a patient with APDS2 (3), and the investigated patient. (C) Schematic representation of mutations affecting splicing of exon 11 annotated in ClinVAR. In red is the mutation of investigated patient. (D) AKT phosphorylation analysis in T-cell blasts (cultured for 13 days) from a healthy control, an APDS2 patient, and the investigated patient. The analysis was performed as described by Deau et al. (3). Mean fluorescence intensity (MFI) is indicated for each sample.

