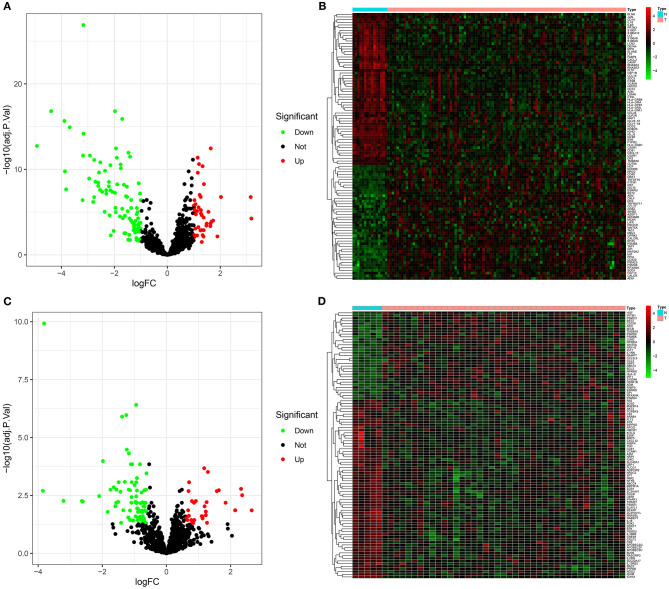
Figure 1.
Abnormally expressed immune-related mRNAs between multiple myeloma and normal bone marrow specimens. (A) Volcano plots for up-regulated (red) and down-regulated (green) immune-related mRNAs in multiple myeloma than normal specimens in the GSE6477 dataset. (B) Hierarchical clustering analyses for differential expression patterns of immune-related mRNAs in multiple myeloma and normal samples in the GSE6477 dataset. N indicates normal samples and T indicates multiple myeloma samples. (C) Volcano plots for highly (red) and lowly (green) expressed immune-related mRNAs in multiple myeloma than normal specimens in the GSE47552 dataset. (D) Heat map for abnormal expression patterns of immune-related mRNAs in multiple myeloma and normal samples in the GSE47552 dataset.

