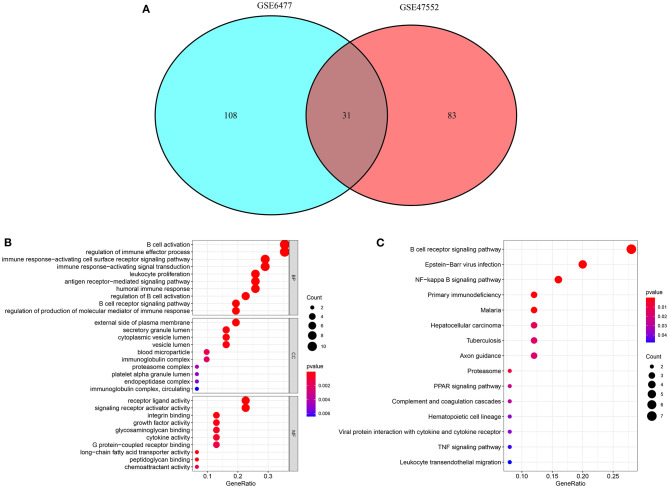
Figure 2.
Functional annotation analyses for dysregulated immune-related mRNAs. (A) Venn diagram for common dysregulated immune-related mRNAs in the GSE6477 and GSE47552 datasets. (B) The top 10 GO results enriched by common mRNAs, composed of biological process (BP), cellular component (CC), and molecular function (MF) terms. (C) KEGG pathways involved in common mRNAs. The size of the bubble is proportional to the count of enriched genes. The more the color tends to red, the smaller the p-value.

