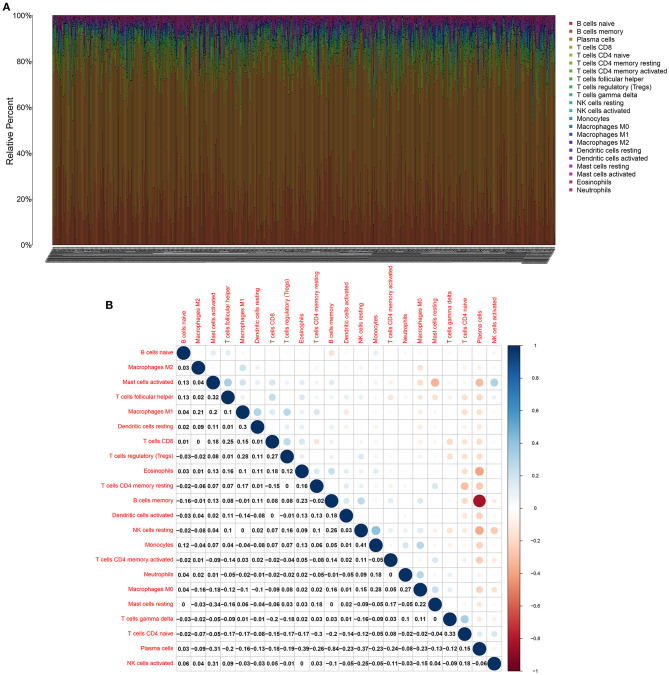
Figure 4.
CIBERSORT identifies tumor immune cells in multiple myeloma bone marrow specimens. (A) Stacked bar chart for the proportions of 22 kinds of immune cells in each multiple myeloma bone marrow samples. Each type of immune cell is identified by a unique color. (B) The correlation between the proportions of immune cells in multiple myeloma bone marrow specimens. Blue indicates negative correlation and red indicates positive correlation. The larger the correlation coefficient, the bigger the bubble.

