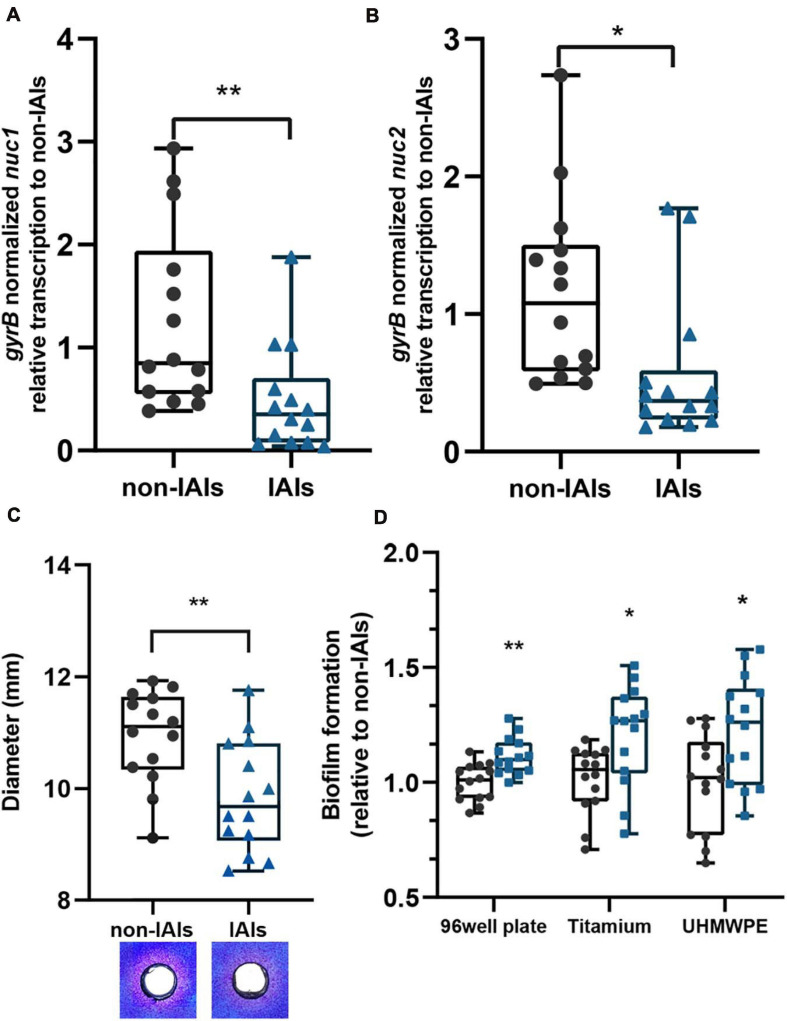
FIGURE 1.
The expression levels of thermonucleases and biofilm-forming ability in clinical isolates. Expression of nuc1 (A) and nuc2 (B) in IAI and non-IAI isolates (n = 14/group) determined by qPCR. (C) Nuclease activity in toluidine blue DNA agar represented in the diameter of red zones. Representative images are also presented. Red zones indicate nuclease activity. (D) Biofilm formation of IAI (n = 14) and non-IAI isolates (n = 14) on different materials including polypropylene 96-well plates (non-IAIs = 1.334 ± 0.103), titanium disk (non-IAIs = 1.664 ± 0.229), and UHMWPE (non-IAI = 1.407 ± 0.284). Biofilm biomass was stained with crystal violet. Statistical significance was calculated using two-tail Student’s t-test in panels (A–C); the multiple t-test (Bonferroni–Dunn’s test) was used in panel (D). *p < 0.05; **p < 0.01 vs. non-IAI strains.

