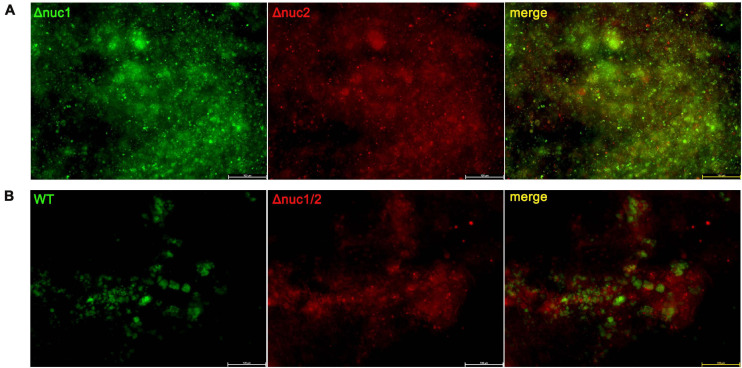
FIGURE 4.
Implant from a competition infection mouse model observed with a fluorescent microscope. Implants were harvested on the seventh day since infection and observed with a fluorescence microscope. (A) Implant from mice infected with a ∼1:1 mixture of Δnuc1 (green) and Δnuc2 (red). (B) Implant from mice infected with a ∼1:1 mixture of WT (green) and Δnuc1/2 (red). Scale bar = 100 μm, n = 3/group.

