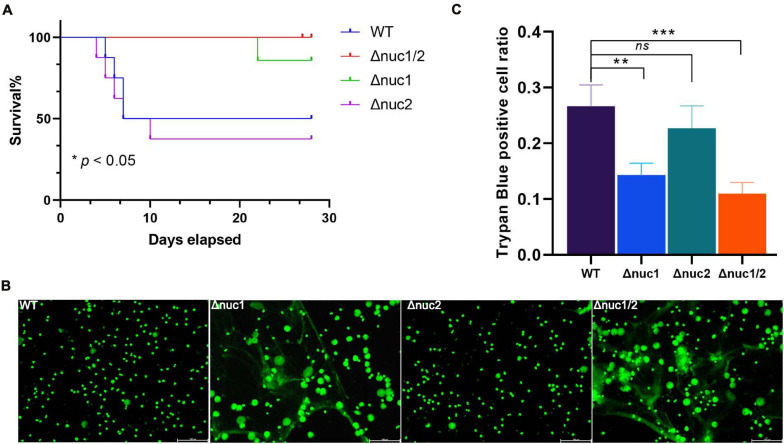
FIGURE 6.
nuc1 and nuc2 involvement in immune evasion. (A) Survival curve for a hematogenous IAI mouse model infected with ST1792 WT, Δnuc2 (n = 8 each), and Δnuc1 and Δnuc1/2 (n = 7 each). (B) Representative fluorescent images for NET degradation assay. S. aureus were incubated with PMA-stimulated neutrophils (n = 3/group). A green signal represents NETs and cell nucleus, scale bar = 100 μm. (C) THP-1 macrophages were incubated with DNA and S. aureus. Cell viability was determined by trypan blue staining (n = 3/group). The survival curve was analyzed with a log-rank (Mantel–Cox) test. ANOVA with Dunnett multiple column comparisons was used in panel (C). **p < 0.01; ***p < 0.001 vs. WT.

