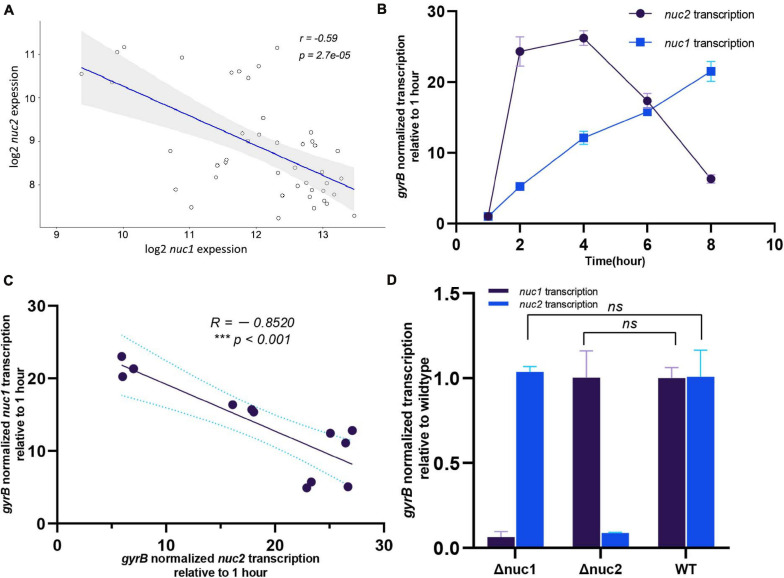
FIGURE 7.
Transcription relationship between nuc1 and nuc2. (A) nuc1 and nuc2 correlation found by analyzing the publicly available data GSE25454. (B) Transcription levels of nuc1 and nuc2 in WT ST1792 at various time points determined through qPCR (n = 3/time point). (C) Transcription levels of nuc2 at various time points (2, 4, 6, and 8 h) were related to nuc1. (D) nuc1 and nuc2 transcription levels in ST1792 WT, Δnuc1, and Δnuc2 determined using qPCR (n = 3/group). A Pearson correlation test was performed in panels (A,C), and unpaired Student’s t test was performed in panel (D).

