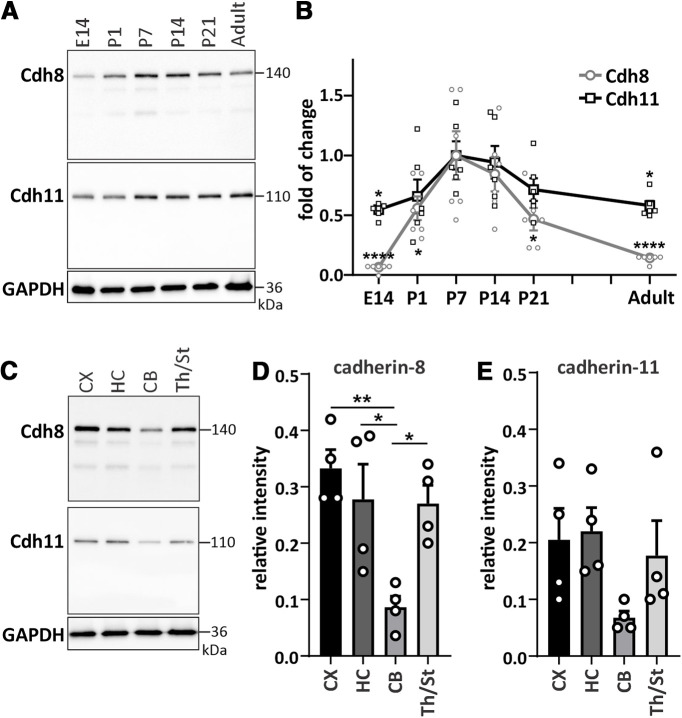
Figure 1.
Cadherin-8 and cadherin-11 show similar temporal and spatial expression patterns. A, Temporal expression profile of cadherin-8 and cadherin-11 in mouse whole brain harvested at different developmental ages. Adult mice were five months old. B, Line graph of temporal expression of the two cadherins. Values were normalized to P7. Cdh8: *p = 0.046 (P1), *p = 0.0123 (P21), ****p < 0.0001; Cdh11: *p = 0.017 (E14), *p = 0.0296 (adult), one-way ANOVA with Dunnett’s multiple comparisons test. N = 6 whole brains per age from three independent litters. C, Expression profiles of cadherin-8 and cadherin-11 in different brain areas, including cortex (CX), hippocampus (HC), cerebellum (CB), and thalamus/striatum (Th/St) at P14. Quantification of (D) cadherin-8 and (E) cadherin-11 expression in different brain regions; *p = 0.0259 between HC and CB, *p = 0.0326 between CB and Th/St, **p = 0.0048 between CX and CB, one-way ANOVA with Tukey’s multiple comparisons test. N = 4 samples per brain area with two to three pooled brain areas per sample. Cadherin signals were normalized to GAPDH. The specificity of anti-cadherin-8 and anti-cadherin-11 antibodies were tested in control experiments (see Extended Data Figure 1-1).

