
Figure 9.
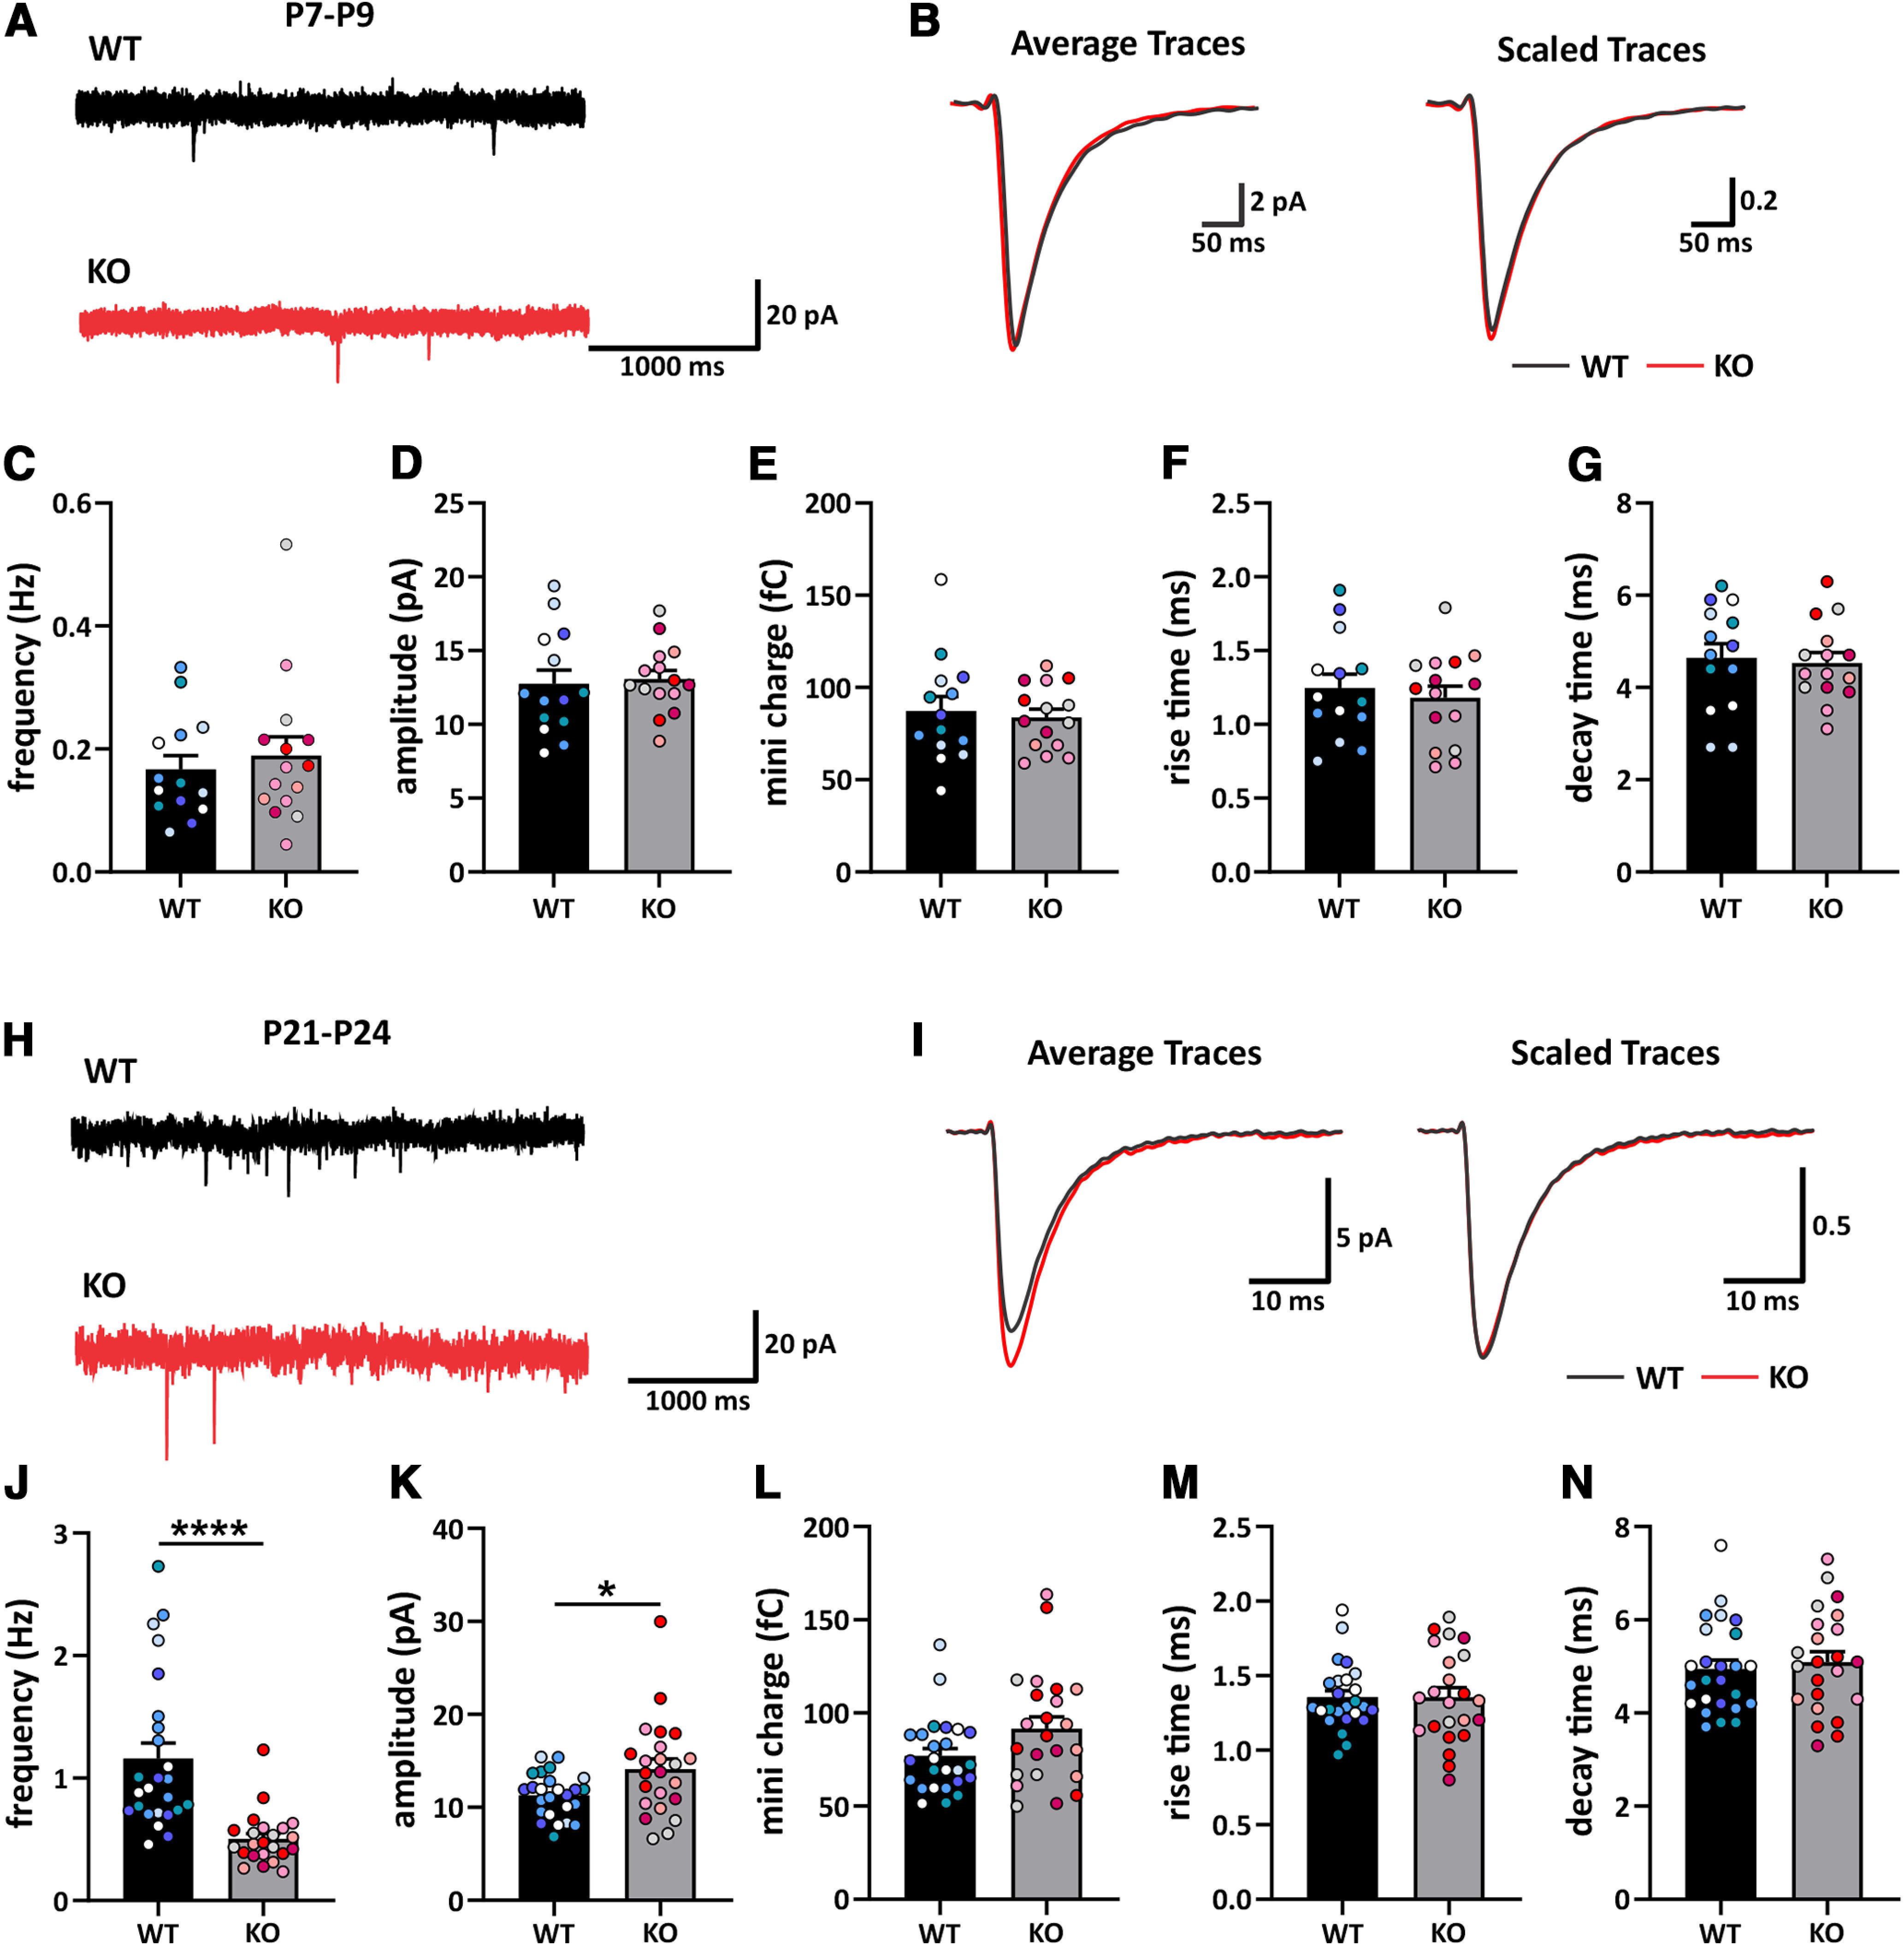
Cdh11−/− mice exhibit changes in mEPSCs. A, Example current traces recorded from whole-cell voltage-clamp of hippocampal CA1 pyramidal neurons from P7–P9 Cdh11 WT and KO mice. B, Examples of average (left) and scaled (right) mEPSC traces from P7–P9 Cdh11 WT and KO cells. Measurement of (C) frequency, (D) amplitude, (E) charge, (F) rise time, and (G) decay time constant of recorded mEPSCs. N = 14 WT and 15 KO neurons from 5 animals per genotype. H, Example current traces recorded from whole-cell voltage-clamp of hippocampal CA1 pyramidal neurons from P21–P24 mice. I, Examples of average (left) and scaled (right) mEPSC traces from P21–P24 Cdh11 WT and KO cells. Measurement of (J) frequency, (K) amplitude, (L) charge, (M) rise time, and (N) decay time constant of recorded mEPSCs; *p < 0.05, ****p < 0.0001, unpaired two-tailed t test. N = 25 WT and 23 KO neurons from 5 animals per genotype. Color codes indicate individual data points from one animal.