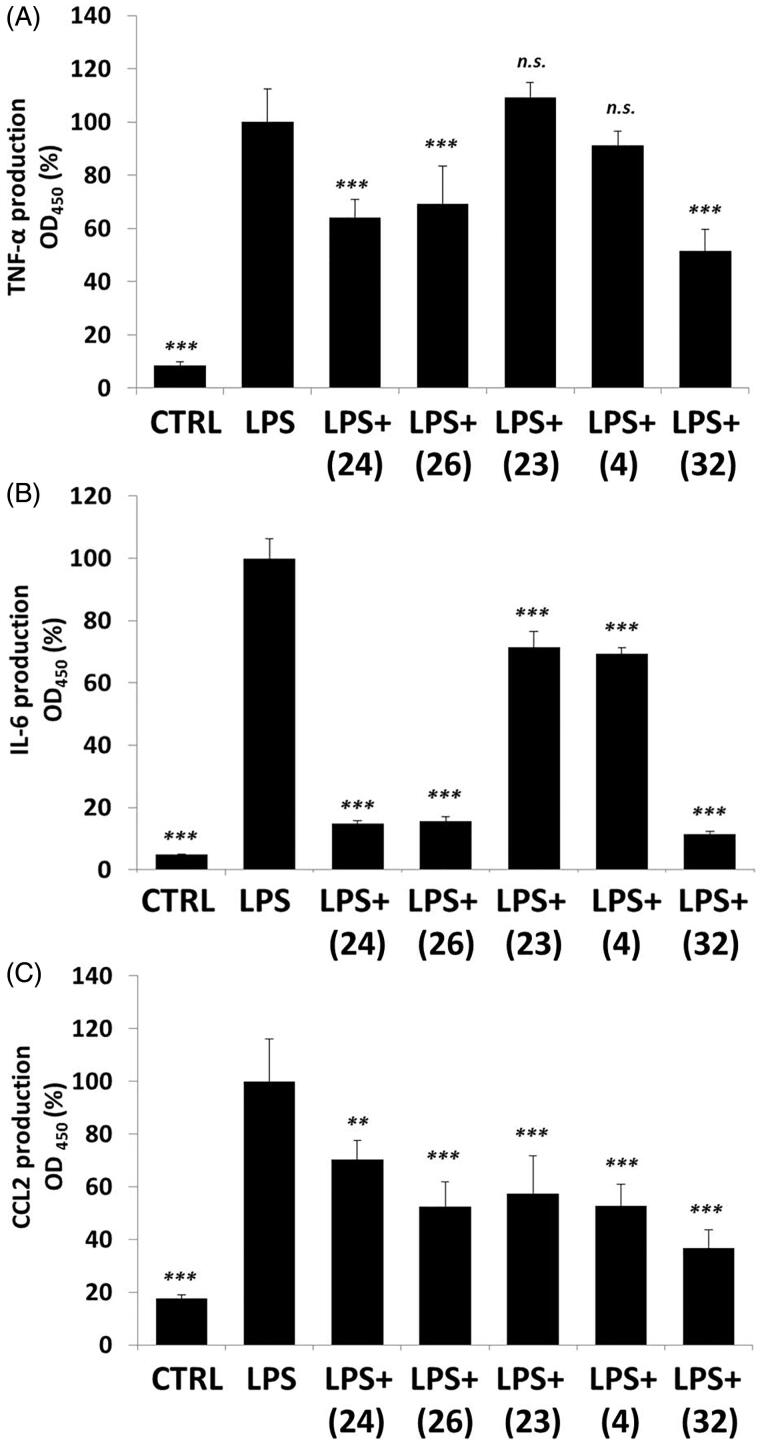
Figure 7.
Cytokine production of activated macrophages: (A) TNF-α; (B) IL-6; (C) CCL-2. LPS-activated RAW264.7 cells were pre-treated with tetralones for 30 min and they were induced by 1 μg/ml LPS for 24 h. Cytokine concentrations were measured with ELISA-kits, optical density was measured at 450 nm. Data are presented as means ± SD in percentage of LPS-treated group; n = 6; Student’s t test; p values < 0.05 were considered significant. **p < 0.01; ***p < 0.001; n.s. = non-significant.

