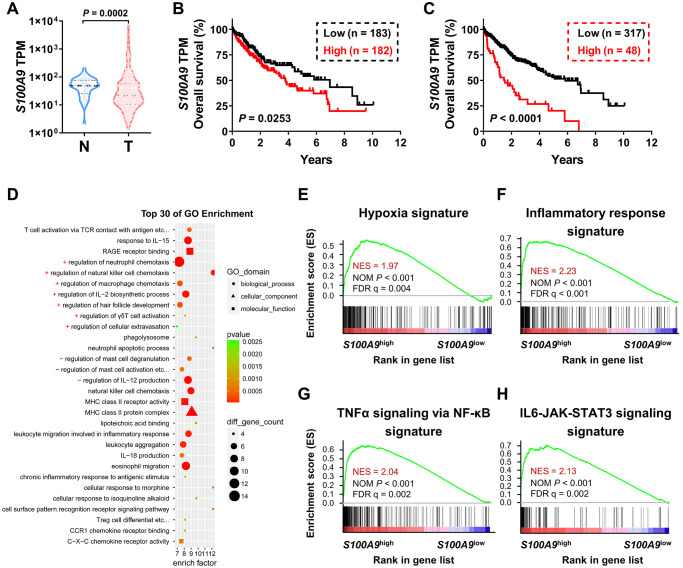
Figure 1.
Association between S100A9 expression and prognosis of HCC patients in the TCGA-LIHC database. (A) Violin plot showing the differential expression of the S100A9 gene in tumor (n = 365) or nontumor (n = 50) tissues from the TCGA-LIHC database; the Mann- Whitney test was used to analyze the nonparametric test between the two groups. HCC patients in the TCGA dataset were divided into two groups according to the median value of S100A9 expression (B) or minimum P-value approach (C). The prognostic value of S100A9 was evaluated by the Kaplan-Meier method, and examined by the log-rank test. (D) Top 30 GO enrichment results of the 3493 genes highly expressed in the S100A9high group. (E–H) Top enriched signaling pathways based on S100A9 expression identified by GSEA.

