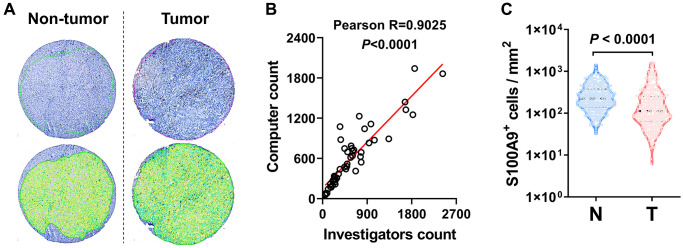
Figure 2.
S100A9 expression in HCC tumor. (A) Representative images of IHC staining. (B) Scatter plot illustrating the correlation between S100A9-expressing cell counts in HCC by computer counting and investigator counting. (C) Quantification of S100A9+ cell densities in the N (nontumoral) and T (tumoral) regions (n = 382), and the Wilcoxon matched-pairs signed-rank test was used to analyze the nonparametric test between the paired two groups.

