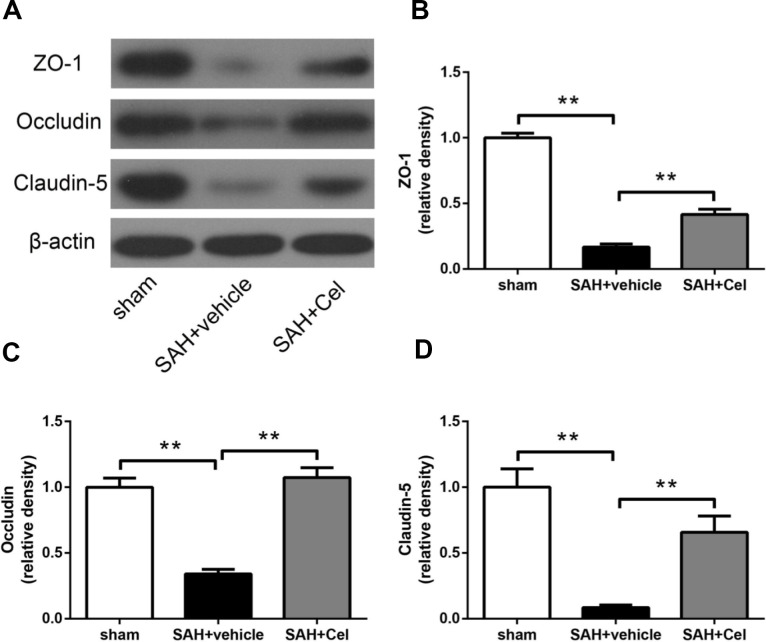
Figure 5.
Effects of celastrol treatment on tight junction proteins at 72 h after SAH induction. (A) Representative western blots showing levels of ZO-1, occludin and claudin-5 in the ipsilateral cortex at 72 h after SAH induction. (B–D) Quantification of band densities of ZO-1, occludin and claudin-5. The densities of the protein bands were analyzed and normalized to β-actin, and compared to the mean value of the sham group. Data were presented as mean±SEM. n = 6. **P < 0.01.

