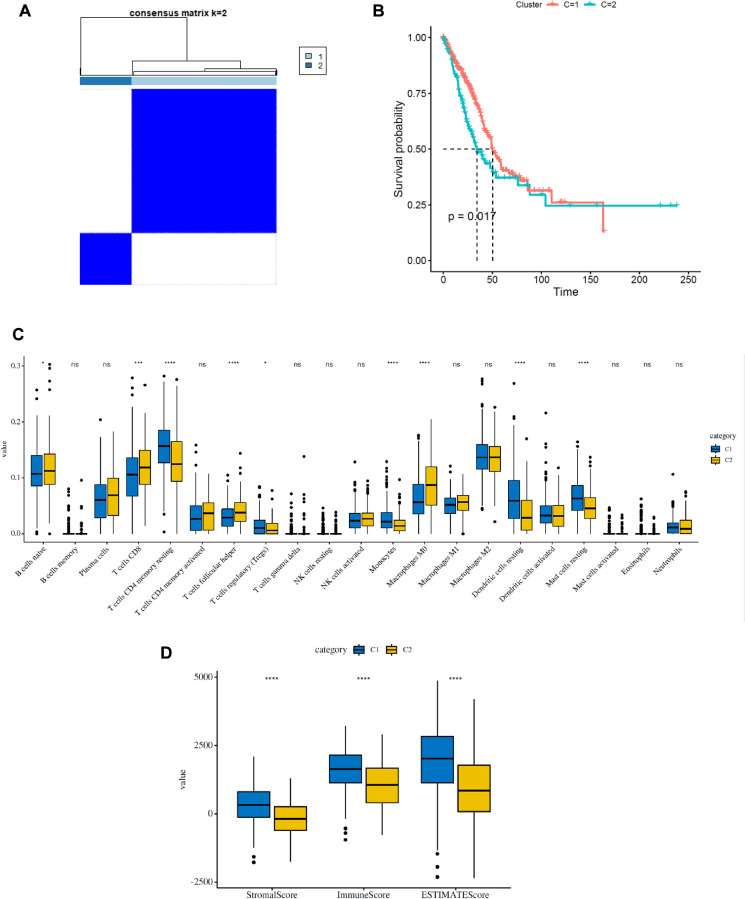
Figure 3.
Consensus clustering analysis of FRGs in LUAD. (A) Consensus clustering matrix for k = 2. (B) Kaplan–Meier curves of the overall survival (OS) of patients with LUAD in two clusters (cluster 1/2) (P = 0.017). (C) The infiltrating levels of 21 immune cell types in two clusters (cluster 1/2). *p < 0.05 and **p < 0.01. (D) Immune score and stromal score of FRG-based clusters.

