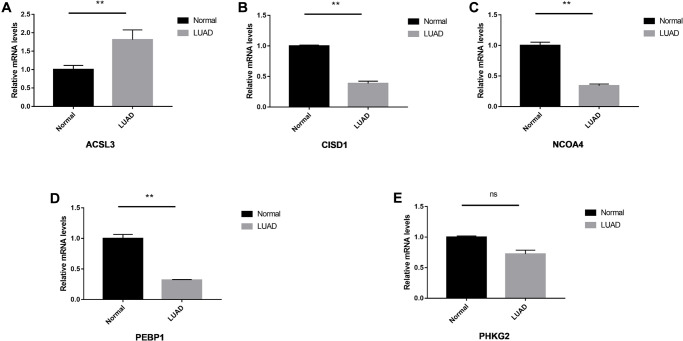
Figure 7.
The relative expression levels of the five genes in normal and LUAD tissues. The ACSL3 (A) was up-regulated significantly and CISD1 (B), NCOA4 (C) and PEBP1 (D) were down-regulated in the LUAD tissues. No significant differences were observed in the PHKG2 (E). *P < 0.05; **P < 0.01, ns: not significant.

