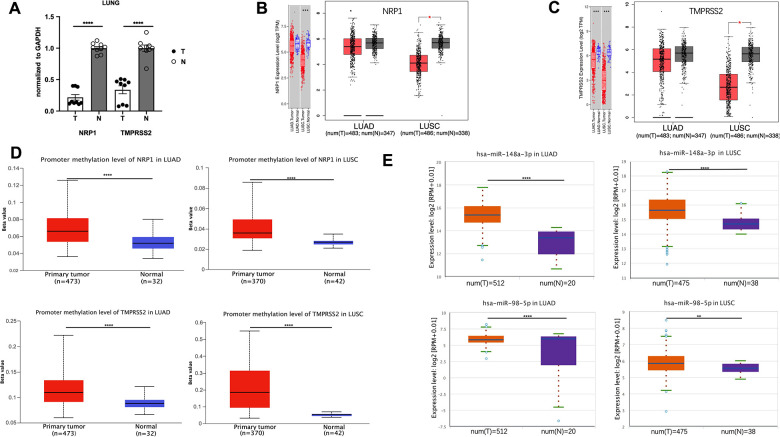
Figure 2.
The promoter methylation level of NRP1(TMPRESS2) and miRNA expression level in lung tumors. (A) qPCR analysis of the expression of NRP1 and TMPRSS2 in LUAD tissues and paired normal tissues. n=3, **** P<0.0001. (B) The expression of NRP1 analyzed with TIMER and GEPIA. (C) The expression of TMPRSS2 analyzed with TIMER and GEPIA. (D)The promoter methylation level of NRP1 and TMPRSS2 in LUAD or LUSC analyzed with UALCAN. (E) The hsa-mir-148a and hsa-mir-98-5p expression level in LUAD and LUSC analyzed with ENCORI.

