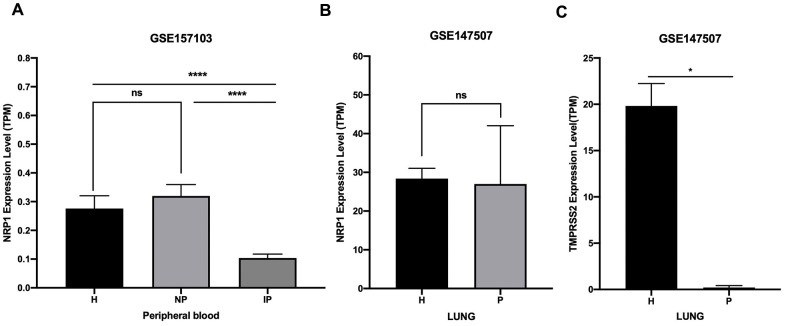
Figure 6.
Expression analysis of NRP1 and TMPRSS2 after SARS-CoV-2 infection. (A) TPM of NRP1 in peripheral blood RNA seq data. H: healthy control. NP: Non-ICU patients with COVID-19. IP: ICU patients with COVID-19. (B) TPM of NRP1 in lung RNA seq data. H: healthy control. P: COVID-19 patients. (C) TPM of TMPRSS2 in lung RNA seq data. H: healthy control. P: COVID-19 patients. ****, P<0.0001. *, P<0.05. ns, not significant.

