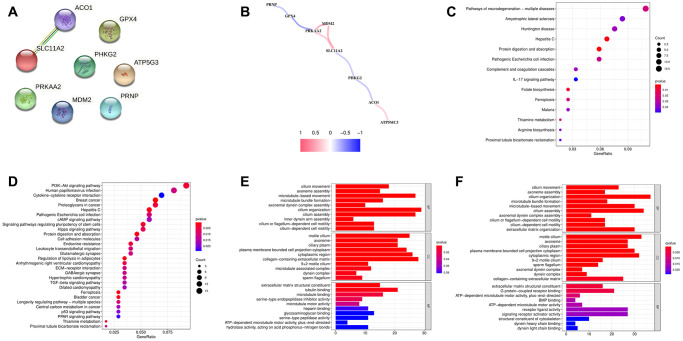
Figure 4.
(A) PPI of eight ferroptosis-related genes (FRGs). (B) Correlation network of the eight FRGs. (C) KEGG analysis of the differentially expressed genes (DEGs) between the low- and high-risk groups in the training cohort. (D) KEGG analysis of the DEGs between the low- and high-risk groups in the testing cohort. (E) GO analysis of the DEGs between the low- and high-risk groups in the training cohort. (F) GO analysis of the DEGs between the low- and high-risk groups in the testing cohort.

