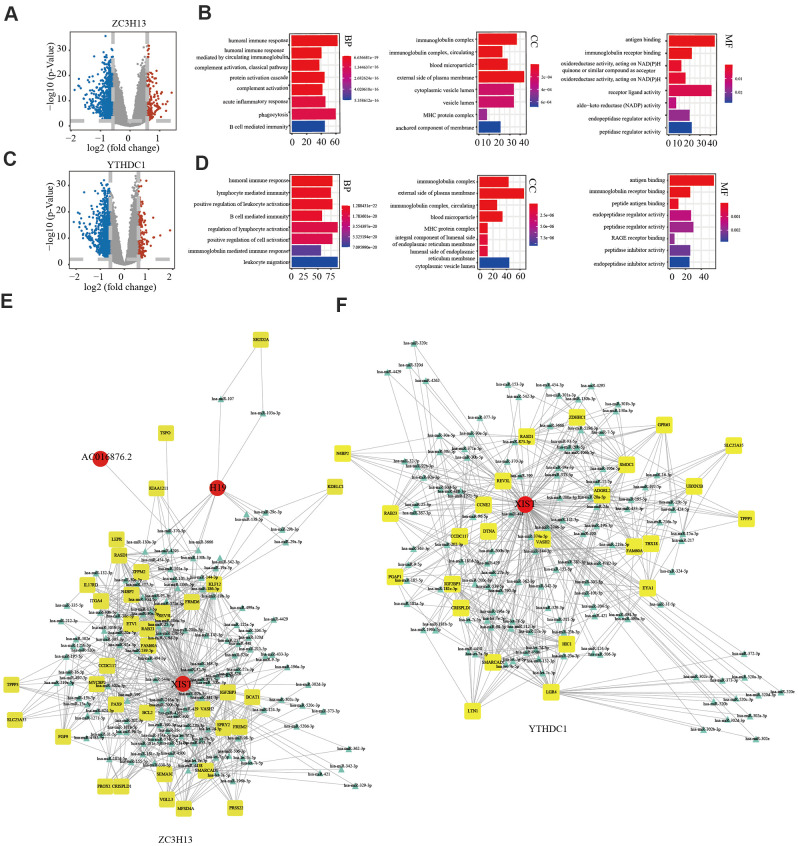
Figure 9.
Potential regulatory mechanism of ZC3H13 and YTHDC1 dysregulation in endometrial cancer. (A) Volcano map showing the differential mRNA, microRNA, and lncRNA expression in patients with low ZC3H13 expression. An absolute log2-fold change (FC) > 1.5 and FDR-adjusted P < 0.01 were used as the cutoff for significantly differentially expressed mRNAs and lncRNAs. Red represents significantly upregulated genes. Blue represents genes that are significantly downregulated. Grey represents genes that are not differentially expressed. (B) The bar graph shows that ZC3H13-regulated expression was enriched for various GO terms. (C) Volcano plot showing differentially expressed transcripts in patients with low YTHDC1 expression. (D) The bar graph shows that YTHDC1-regulated expression was enriched for various GO terms. (E, F) The ceRNA regulatory network in patients with low expression of ZC3H13 and YTHDC1. Red indicates lncRNA; yellow indicates mRNA; blue indicates microRNA.

