Figure 4.
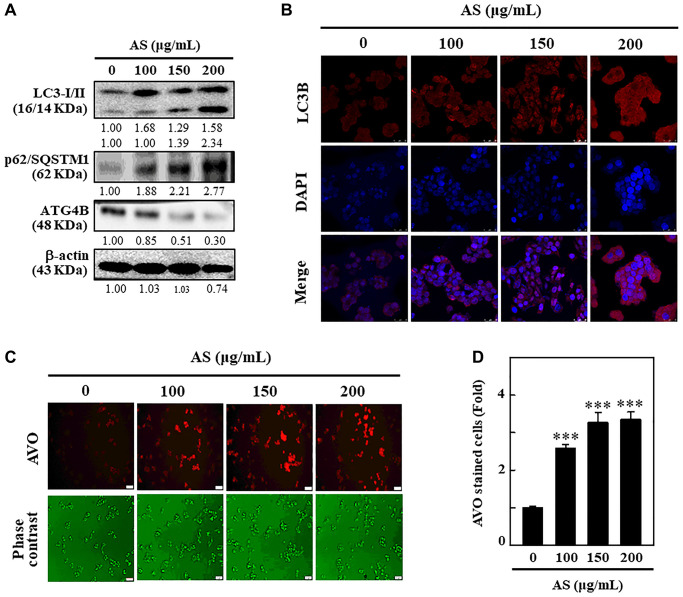
Induction of autophagy in SW620 cells by AS treatment. (A) AS triggers autophagy signaling molecules in SW620 cells. Cells were treated with AS (100, 150, and 200 μg/mL for 24 h, and then conversion of LC3-I to LC3-II and the expressions of p62/SQSTM1 and ATG4B were determined by Western blotting. β-actin was used as a loading control. Relative changes in the intensities of protein bands were measured by commercially available quantitative software. (B) Immunofluorescence detection of LC3B in the cells treated with AS (100, 150, and 200 μg/mL) for 24 h. (C) Cells were treated with 100, 150, and 200 μg/mL of AS for 24 h and stained with acridine orange for AVOs detection in untreated or AS-treated cells. The cells were examined through a red filter of fluorescence microscope. (D) The fold of cells with AVOs are represented in bar diagram. Values are expressed as the mean ± SD (n = 3). ***p < 0.001 is significant when compared with untreated control cells.

