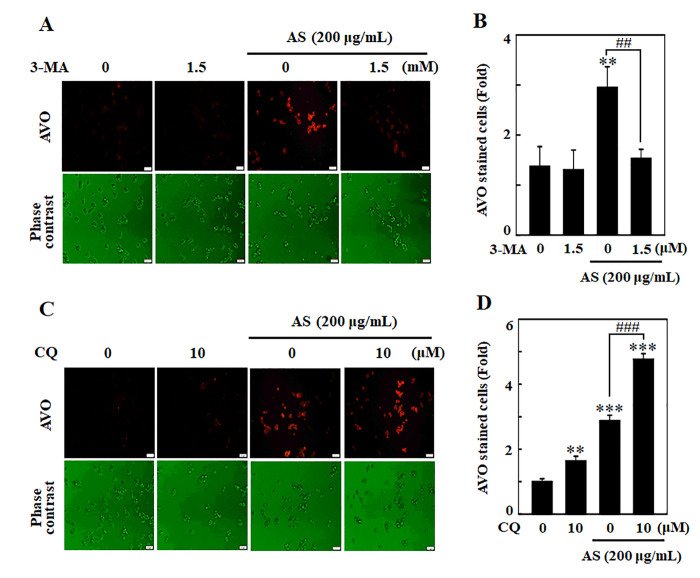
Figure 5.
Inhibition of AS-induced autophagy by 3-MA and CQ inhibitors in SW620 cells. Cells were pretreated with autophagy inhibitor (A) 3-MA (1.5 mM) for 1 h followed by incubation with or without AS (200 μg/mL) for 24 h. Cells were stained with acridine orange and visualized under a red filter fluorescence microscope for AVOs measurement and (B) the fold of cells with AVOs are represented in bar diagram. Cells were pretreated with autophagy inhibitor (C) CQ (10 μM) for 1 h followed by incubation with or without AS (200 μg/mL) for 24 h. Cells were stained with acridine orange and visualized under a red filter fluorescence microscope for AVOs measurement and (D) the fold of cells with AVOs are represented in bar diagram. Results are expressed as the mean ± SD of three independent assays. **p < 0.01 or ***p < 0.001 is significant when compared with untreated control cells as well as ##p < 0.01 or ###p < 0.001 is significant when compared with AS-treated cells.

