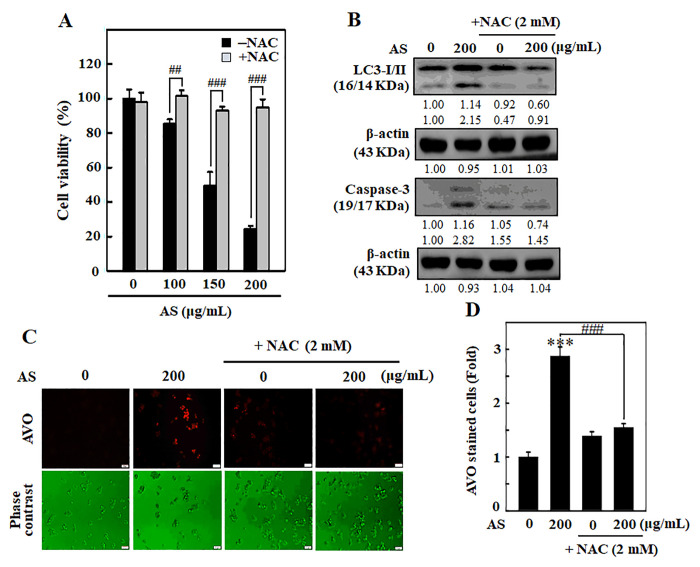
Figure 8.
ROS is involved in AS-activated autophagy and apoptosis in SW620 cells. Cells were earlier treated with or without ROS inhibitor (NAC, 1 mM) for 1 h, followed by AS (100–200 μg/mL) treatment for 24 h. (A) Cell viability was assayed by the MTT assay. (B) The expressions of LC3-I/II and Caspase-3 were measured by Western blotting. The relative changes in the expression of protein bands were estimated by commercially available quantitative software representing control as 1-fold. (C) Cells were stained with acridine orange and visualized through a red filter fluorescence microscope to detect AVOs. (D) The fold of cells with AVOs are represented in bar diagram. Results are expressed as the mean ± SD of three independent assays. ***p < 0.001 is significant when compared with untreated control cells and ##p < 0.01 or ###p < 0.001 is significant when compared with AS-treated cells.

