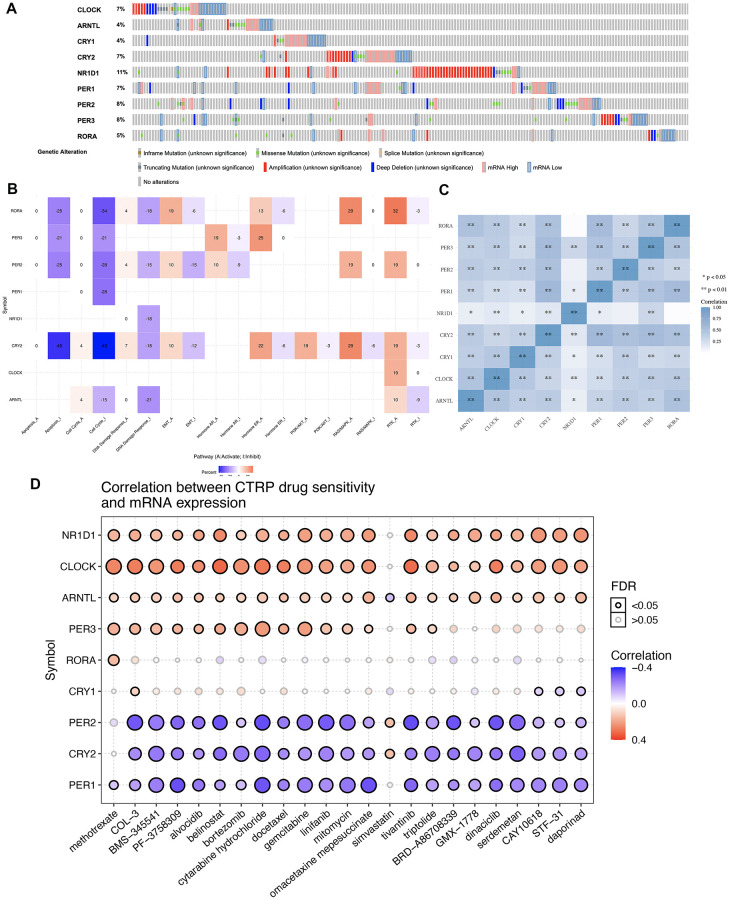
Figure 2.
Genetic mutation landscape and drug sensitivity analysis of core circadian clock genes in STAD. (A) Oncoplot displaying genetic mutation landscape of core circadian clock genes in TCGA STAD cohort. (B) the role of circadian clock genes in the famous cancer related pathways. (C) A heat map of the correlation between each member of core circadian clock genes. (D) the correlation between core circadian clock genes and drug or small molecules. The Spearman correlation represent the core circadian clock genes expression correlates with the drug. The positive correlation means that the gene high expression is resistant to the drug, vise verse. *p < 0.05, **p < 0.01.

