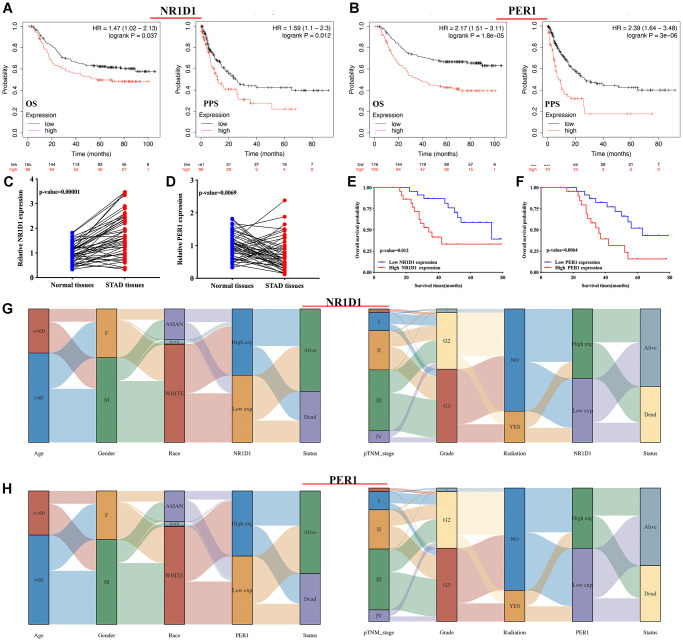
Figure 6.
The prognosis value and expression of core circadian clock genes in the subtypes of STAD tissues. (A, B) The overall survival and progression-free survival curve of STAD patients with high/low NR1D1(A) and PER1(B) expression. (C, D) The relative expression of NR1D1 and PER1 in STAD tissues and normal tissues in clinical cohort. (E, F) The overall survival curve of STAD patients with high/low NR1D1 and PER1 expression in clinical cohort. (G) The expression of NR1D1 in the subtypes of STAD tissues. (H) The expression of PER1 in the subtypes of STAD tissues. Each column represents a characteristic variable, different colors represent different subtypes of STAD tissues, and lines represent the distribution of the same sample in different characteristic variables.

