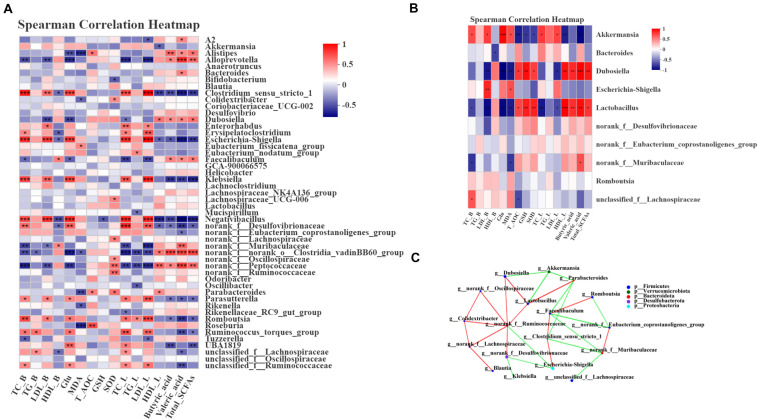
FIGURE 6.
Spearman correlation between key phylotypes, their relative abundance, and biochemical parameters. (A) Correlation between phylotypes and biochemical parameters of samples from the NC, HFD, PGLT and HFLRB groups; (B) correlation between the HFD and HFLRB groups. P values for the correlations are calculated: * represents P < 0.05, ** represents P < 0.01, *** represents P < 0.001. A positive correlation is labeled in red, and a negative correlation is labeled in blue. (C) Cooccurrence network analysis of the 18 most abundant genera deduced from two groups of diabetic and FLRB-treated diabetic mice. The size of the nodes indicates the number of phylotypes. The lines connecting each node represent the Spearman correlation coefficient values that were above 0.4 (red) or below –0.4 (green).

