. 2021 Jun 25;10:e62578. doi: 10.7554/eLife.62578

Figure 5. Adaptation and de novo learning exhibit distinct frequency-dependent signatures.

We estimated how participants transformed target motion into hand movement across different frequencies (i.e., gain matrix analysis). (A) Visualizations of the gain matrices relating target motion to hand motion across frequencies (associated gain matrices can be found in Figure 5—figure supplement 1). These visualizations were generated by plotting the column vectors of the gain matrices from one trial of each listed block, averaged across participants. Green and purple arrows depict hand responses to x- and y-axis target frequencies, respectively. Darker and lighter colors represent lower and higher frequencies, respectively. (B) Average of the two off-diagonal values of the gain matrices at different points during learning. Grey boxes indicate when the rotation or mirror reversal were applied. (C) (Top) Compensation angle as a function of frequency for the rotation group. (Bottom) Gain of movement orthogonal to the mirror axis for the mirror-reversal group. Green and black dashed lines show ideal compensation when the perturbation is or is not applied, respectively. All error bars in this figure are SEM across participants.

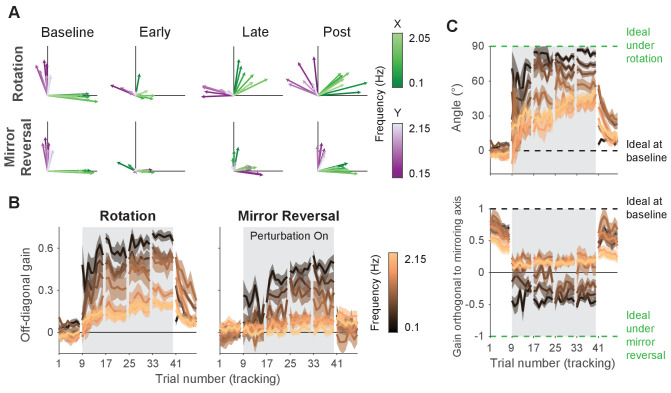
Figure 5—source data 1. This file contains the results of all statistical analyses performed on the data in Figure 5B.

Figure 5.

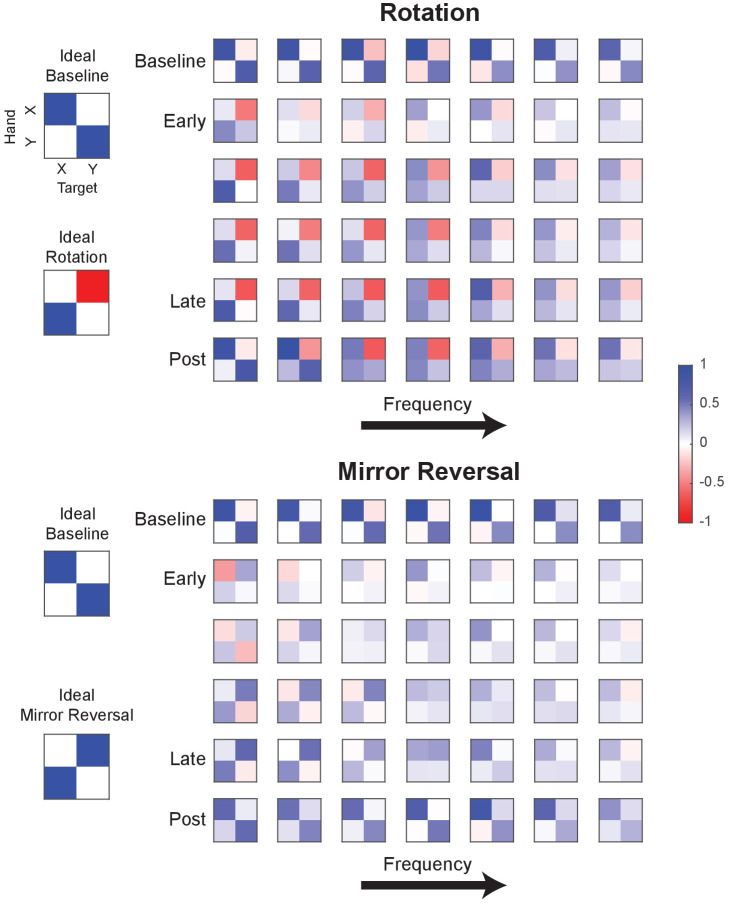
Figure 5—figure supplement 1. Example gain matrices for each block and frequency.

Figure 5—figure supplement 1.

Gain matrices fitted for different frequencies (0.1–2.15 Hz) of hand movement. Each element within a 2×2 matrix is the gain estimated between hand and target movement at a particular frequency. Each row of matrices displays the data from one trial of a tracking block (averaged across participants) and each column is a frequency (frequencies increase from left to right). Although only one trial of each block is depicted, other trials within each block were qualitatively similar. Figure 5A was created by plotting the left column vector of each matrix as a green arrow and the right column vector as a purple arrow.
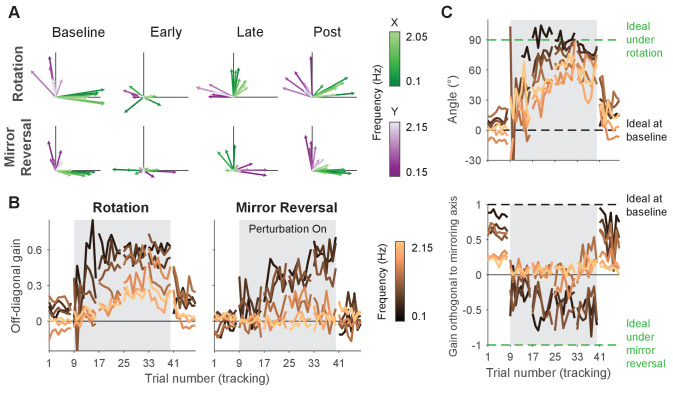
Figure 5—figure supplement 2. Gain matrix analysis performed on single-subject data.

Figure 5—figure supplement 2.

Gain matrix analysis, identical to the one performed in Figure 5 except performed on a single subject from each group. (A) Visualizations of gain matrices from a single trial in each listed block. (B) Average of the off-diagonal values of the gain matrix. (C) Compensation angle for the rotation group and gain orthogonal to the mirror axis for the mirror-reversal group. Note that compensation angles could not be computed for every trial using our singular value decomposition approach, so several data points are missing in the figure (see ‘Trajectory-alignment analysis’ for details on this approach).