. 2021 Jun 16;10:e65532. doi: 10.7554/eLife.65532

Figure 1. Location of sampling sites and climate history.

(A) Locations of sampling sites in Hessen, Germany. For abbreviations, see Supplementary file 1A. The sites where confirmation individuals were sampled are designated in grey. (B) Principal component analysis of monthly climate data 1950–2019. (C) Development of main growth period drought indicator from 1991 to 2019. Shown is the difference mean monthly evaporation potential in mm from April to September relative to the 1991 level. Climate and drought data obtained from https://opendata.dwd.de/climate_environment/CDC/grids_germany/monthly/.

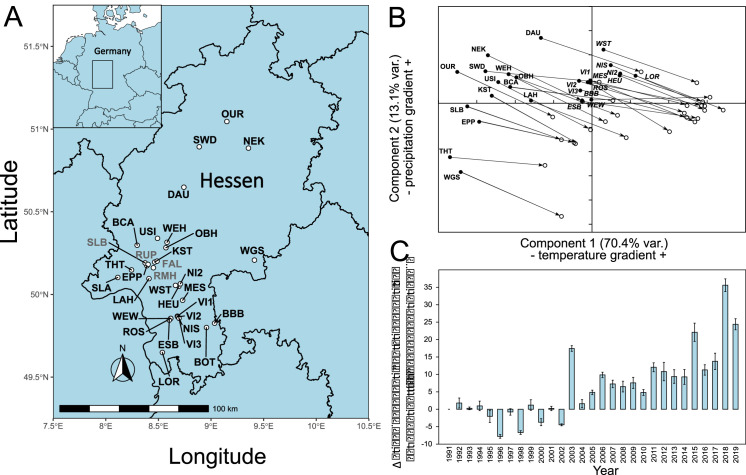
Figure 1.

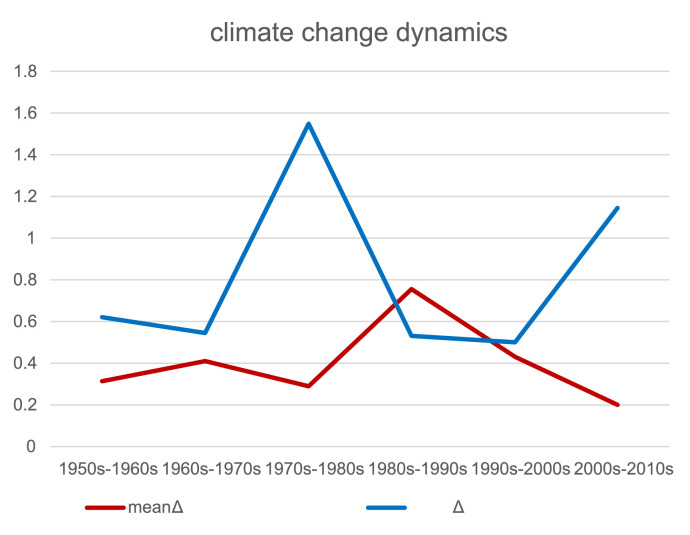
Figure 1—figure supplement 1. Climate change dynamics.

Figure 1—figure supplement 1.

Mean change of sampling site values along principal component analysis (PCA) axis 1 (temperature, red) and PCA axis 2 (precipitation, blue) among decades.
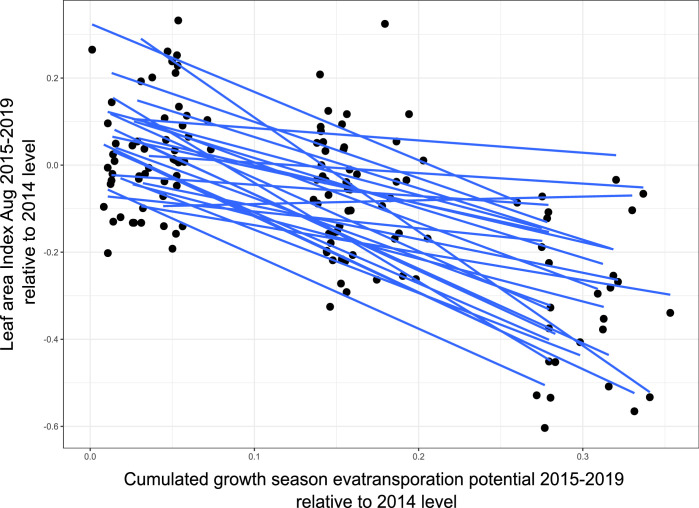
Figure 1—figure supplement 2. Plot of ‘relative leaf area index’ change relative to 2014 values against ‘cumulated evatransporation potential’ change during the growth season relative to 2014 values for all 1 × 1 km plots encompassing the 27 sampling sites.

Figure 1—figure supplement 2.

The overall correlation is r = 0.695.