. 2021 May 26;10:e54894. doi: 10.7554/eLife.54894

Figure 2. The Nodal gradient is expanded in MZoep mutants.

(A-C) Sensor cell assay and gradient quantifications in (A) wild type, (B) MZoep, and (C) lft1-/-;lft2-/- embryos. Mvg1 sensor cells were marked with GFP (yellow) and transplanted to the margin of host embryos. Nodal signaling activity is measured by α-pSmad2 immunostaining (magenta). YSL boundaries are marked with dashed curves and sensor cell boundaries are outlined in solid white in all α-pSmad2 panels. Gradient quantifications for each experiment are below images; host and sensor cell staining intensities are plotted as blue and red points, respectively. Sliding window averages are plotted as solid curves. Plots for wild type, MZoep, and lft1-/-;lft2-/- backgrounds were derived from 8, 10, and 8 replicate embryos, respectively. Decay parameters for single-exponential model fits (±95% confidence bounds) are −0.02 ± 0.004 μm−1,–0.007 ± 0.002 μm−1 and −0.013 ± 0.002 μm−1 for wild-type, MZoep and lft1-/-;lft2-/ hosts, respectively. (D) Left panel; Mvg1 sensor cells (yellow) were transplanted directly to the animal pole of a wild-type host. The endogenous Nodal signaling gradient is visible at the embryonic margin (magenta). White box highlights region expanded for detail view in right panel. Right panel; Nodal signaling activity is absent in both host and sensor cells. (E) Left panel; Mvg1 sensor cells (yellow) were transplanted to the animal pole of an MZoep embryo. Nodal signaling is absent at the embryonic margin. White box highlights region expanded in the right panel. Right; sensor cells detect Nodal at the animal pole (magenta).

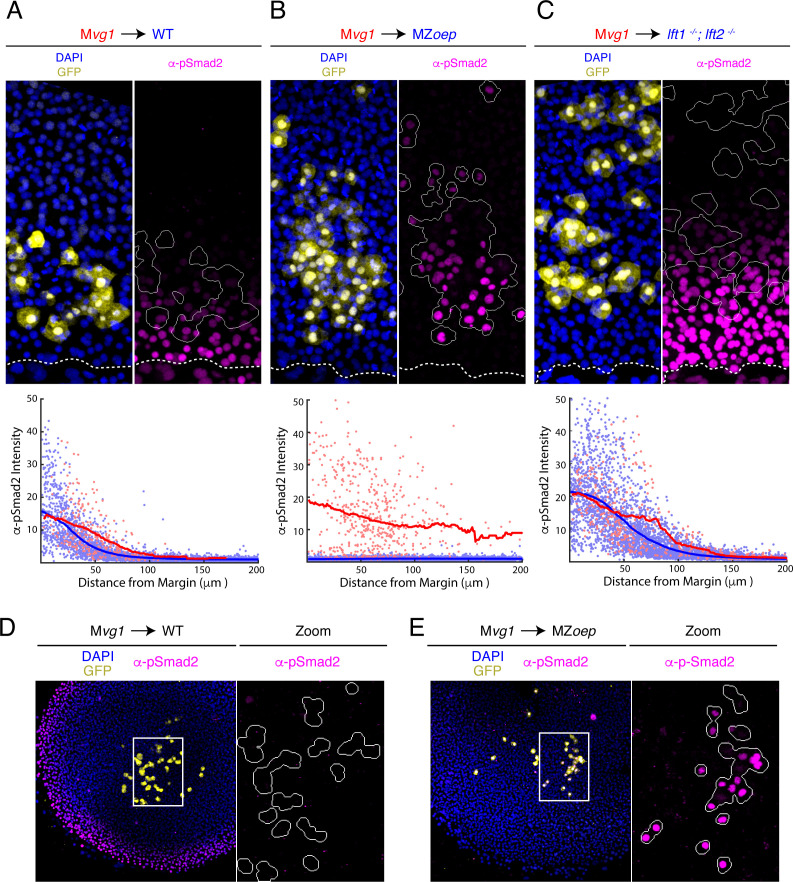
Figure 2—source data 1. In Figure 2A, sensor cell assay results were quantified by segmenting nuclei and classifying each nucleus as host- or donor-derived by GFP intensity.
The quantified fluorescence intensities are organized in this table. Each row corresponds to an individual nucleus. The following characteristics were quantified: average GFP pixel intensity (‘GFP’), average pixel intensity for α-pSmad2 staining (‘pSmad2Raw’), α-pSmad2 staining intensity normalized to background (‘pSmad2 Normalized’), average DAPI pixel intensity (‘DAPI’), distance from the embryonic margin in μm (‘marginDist’), GFP staining status (‘GFP_Flag’, 0 denotes a cell host nucleus, one denotes a sensor cell nucleus), and embryo replicate number (‘Embryo Number’). We note that normalized α-pSmad2 staining was used to generate the figure panel.
Figure 2—source data 2. In Figure 2B, sensor cell assay results were quantified by segmenting nuclei and classifying each nucleus as host- or donor-derived by GFP intensity.
The quantified fluorescence intensities are organized in this table. Each row corresponds to an individual nucleus. The following characteristics were quantified: average GFP pixel intensity (‘GFP’), average pixel intensity for α-pSmad2 staining (‘pSmad2Raw’), α-pSmad2 staining intensity normalized to background (‘pSmad2 Normalized’), average DAPI pixel intensity (‘DAPI’), distance from the embryonic margin in μm (‘marginDist’), GFP staining status (‘GFP_Flag’, 0 denotes a cell host nucleus, one denotes a sensor cell nucleus), and embryo replicate number (‘Embryo Number’). We note that normalized α-pSmad2 staining was used to generate the figure panel.
elife-54894-fig2-data2.xlsx (474.2KB, xlsx)
Figure 2—source data 3. In Figure 2C, sensor cell assay results were quantified by segmenting nuclei and classifying each nucleus as host- or donor-derived by GFP intensity.
The quantified fluorescence intensities are organized in this table. Each row corresponds to an individual nucleus. The following characteristics were quantified: average GFP pixel intensity (‘GFP’), average pixel intensity for α-pSmad2 staining (‘pSmad2Raw’), α-pSmad2 staining intensity normalized to background (‘pSmad2 Normalized’), average DAPI pixel intensity (‘DAPI’), distance from the embryonic margin in μm (‘marginDist’), GFP staining status (‘GFP_Flag’, 0 denotes a cell host nucleus, one denotes a sensor cell nucleus), and embryo replicate number (‘Embryo Number’). We note that normalized α-pSmad2 staining was used to generate the figure panel.
elife-54894-fig2-data3.xlsx (392.6KB, xlsx)

Figure 2.

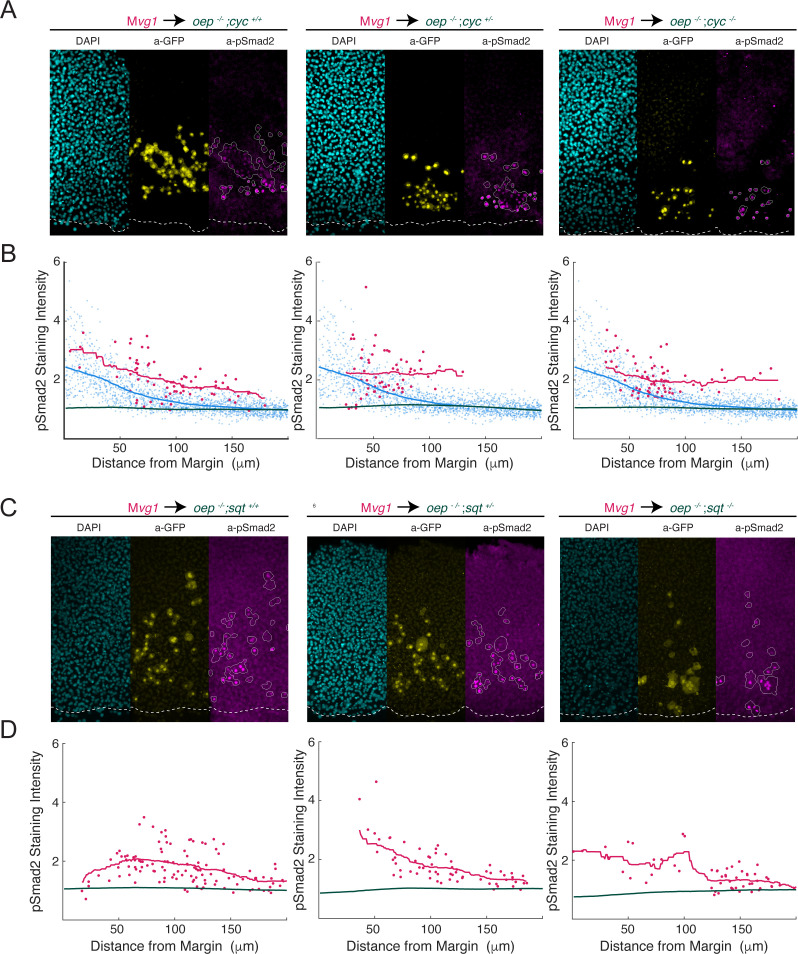
Figure 2—figure supplement 1. Cyclops and Squint signal over a long range in the absence of Oep.

Figure 2—figure supplement 1.

To test whether Cyclops and Squint spread over a long range in the absence of Oep, we generated MZoep;cyc and MZoep;sqt double mutants and performed sensor cell assays. (A) Squint signals over a long range in the absence of Oep. Representative sensor cell assays for MZoep;cyc+/+ (left), MZoep;cyc+/- (middle) and MZoep;cyc-/- (right) are presented. Mvg1 sensor cells are marked with α-GFP immunostaining (yellow), and sensor cell boundaries are outlined in white in the α-pSmad2 images (magenta). YSL boundaries are marked with a white dashed curve in all images. (B) Quantification of Nodal signaling in sensor (red) and host cells (green) in MZoep;cyc double mutant embryos. Host cells lack oep, and so represent immunostaining background. A pSmad2 gradient from a wild-type embryo was quantified and plotted in each panel for comparison (blue). Gradients for MZoep;cyc+/+ (left), MZoep;cyc+/- (middle) and MZoep;cyc-/- (right) were derived from 2, 2 and 3 replicate embryos, respectively. Sliding window averages are plotted as solid curves. (C) Cyclops signals over a long range in the absence of Oep. Representative sensor cell assays for MZoep;sqt+/+ (left), MZoep;sqt+/- (middle) and MZoep;sqt-/- (right) are presented. Mvg1 sensor cells are marked with α-GFP immunostaining (yellow), and sensor cell boundaries are outlined in white in the α-pSmad2 images (magenta). (D) Quantification of Nodal signaling in sensor (red) and host cells (green) in MZoep;sqt double mutant embryos. Host cells lack oep, and so represent immunostaining background. Gradients for MZoep;sqt+/+ (left), MZoep;sqt+/- (middle) and MZoep;sqt-/- (right) were derived from 4, 3, and 5 replicate embryos, respectively. Sliding window averages are plotted as solid curves.
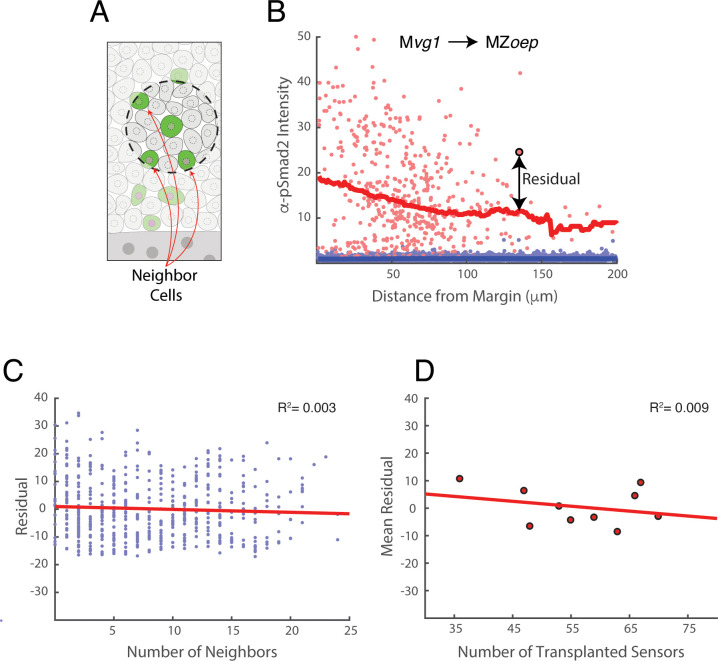
Figure 2—figure supplement 2. Clustering does not contribute to Nodal sensitivity in sensor cells.

Figure 2—figure supplement 2.

Our transplantation procedure leads to random variation in the number and position of sensor cells in host embryos. We therefore investigated whether clustering (i.e. variation in the number of nearby sensor cells) affects the behavior of each sensor. The data presented in this figure derive from the Mvg1 to MZoep sensor cell experiment of main text Figure 2B. (A) Definition of neighboring cells. For each sensor cell (center of dashed circle), sensor cells within a 30 μm radius (area within dashed circle) are counted as neighbors. (B) Illustration of pSmad2 staining residual using main text Figure 2B. We define the pSmad2 staining residual for each sensor as the difference between its observed staining intensity and the expected intensity given its distance from the Nodal source. In this illustration, the residual for the highlighted sensor cell (large red point) is the vertical distance (arrow) to the sliding window average of all sensor cells (red curve). Host cell staining intensities are depicted as blue points. (C) Neighbor number does not influence pSmad2 staining residual. Scatter plot of the number of sensor cells within a 30 μm radius against pSmad2 staining residual. Each point represents a sensor cell, and the figure pools sensors from 10 host embryos. The least-squares linear fit is plotted (red line, R2 = 0.003). If Nodal sensitivity increased or decreased with the number of nearby sensors, the plot would show an increasing or decreasing trend, respectively. (D) Sensor behavior is independent of total number of transplanted cells. The total number sensors transplanted into each MZoep host embryo is scattered against the average pSmad2 staining residual for all sensors in that embryo. The least-squares linear fit is plotted (red line, R2 = 0.009). If Nodal sensitivity increased or decreased with the total number of transplanted cells, the plot would show a clear positive or negative trend, respectively.
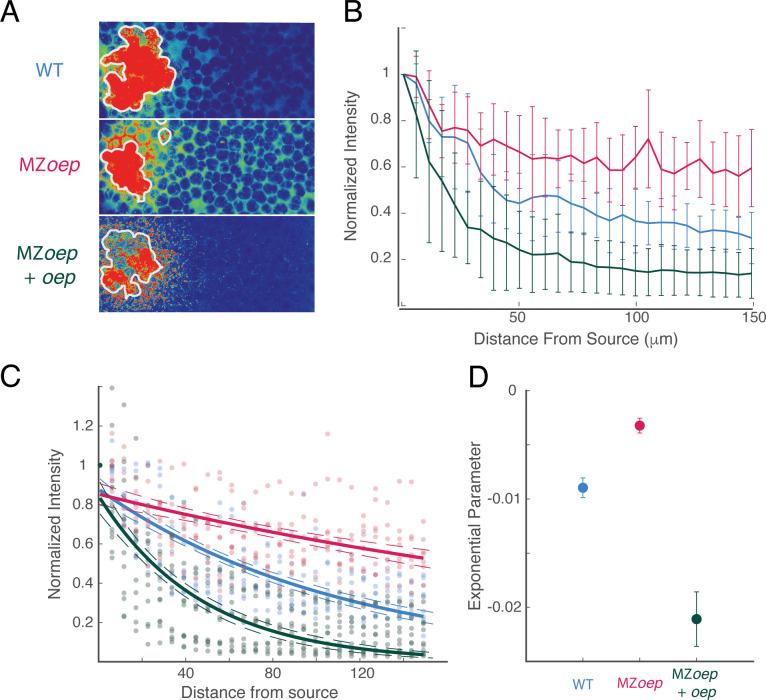
Figure 2—figure supplement 3. The Nodal ligand gradient is shaped by oep expression.

Figure 2—figure supplement 3.

(A) Measurement of Squint-sfGFP gradients generated by transplanted source cells. Donor embryos were injected with 250 pg sqt-sfgfp mRNA and Alexa-647 dextran at the one-cell stage. At sphere stage, cells from the animal pole of donor embryos were transplanted to the animal pole of wild-type (top), MZoep (middle), or MZoep embryos injected with an excess of oep mRNA at the one-cell stage. Gradients were visualized in grafted embryos by confocal microscopy 100 min after transplantation. Images are maximum intensity projections of 15 consecutive confocal slices. White contours mark source boundaries as determined by segmentation of Alexa-647 channel images. (B) Quantification of Squint-sfGFP gradients created by ectopic sources. Average GFP intensities at each position were compiled from maximum intensity projections and normalized to the intensity adjacent to the source. Gradients from wild-type (blue), MZoep (red) and oep-injected MZoep (green) embryos were compiled from 9, 8, and 11 grafted embryos, respectively. Error bars denote the standard error of the mean at each position. (C) Exponential fits for gradients in wild-type (blue), MZoep (red), and oep-injected MZoep (green) hosts are plotted. Dashed contours indicate 95% confidence intervals for each exponential fit. Experimental data for each condition are scattered as points in the corresponding color. (D) Comparison of exponential fit parameters for wild-type (blue), MZoep (red), and oep-injected MZoep (green) host embryos. Error bars denote 95% confidence intervals.