
Figure 1. BLA neurons are activated during stimulus-outcome learning.
(a). Procedure schematic. CS, conditional stimulus (white noise or tone); O, outcome (sucrose solution or food pellet). (b) Schematic of fiber photometry approach for imaging bulk calcium activity in BLA neurons. (c) Representative fluorescent image of GCaMP6f expression and fiber placement in the BLA. (d) Schematic representation of GCaMP6f expression and placement of optical fiber tips in BLA for all subjects. Brain slides from Paxinos and Watson, 1998. (e) Representative examples of GCaMP6f fluorescence changes (Z-scored ∆F/F) in response to CS presentation (blue box), reward delivery, and reward retrieval (first food-port entry following reward delivery) across days of training. Traces from the last 6 days of training were selected from one of each two-session bin. See Figure 1—figure supplement 2 for raw GCaMP and isosbestic signal fluctuations. (f-g) Trial-averaged GCaMP6f fluorescence changes (Z-scored ∆F/F) in response to CS onset (f; blue) or reward retrieval during the CS (g; orange) across days of training. Shading reflects between-subjects s.e.m. Data from the last six sessions were averaged across two-session bins (3/4, 5/6, and 7/8). (h) Elevation [(CS probe entry rate)/(CS probe entry rate + preCS entry rate)] in food-port entries during the CS probe period (after CS onset, before first reward delivery), averaged across trials and across the 2 CSs for each day of Pavlovian conditioning. Gray lines represent individual subjects. (i-j) Trial-averaged quantification of maximal (i; peak) and area under the GCaMP Z-scored ∆F/F curve (j; AUC) during the 3 s period following CS onset or reward retrieval compared to equivalent baseline periods immediately prior to each event. Thin light lines represent individual subjects. N = 11 (see Figure 1—figure supplement 3 for data from N = 8 subjects with longitudinal data from each session). *p<0.05, **p<0.01 relative to pre-event baseline. See Figure 1—source data 1.
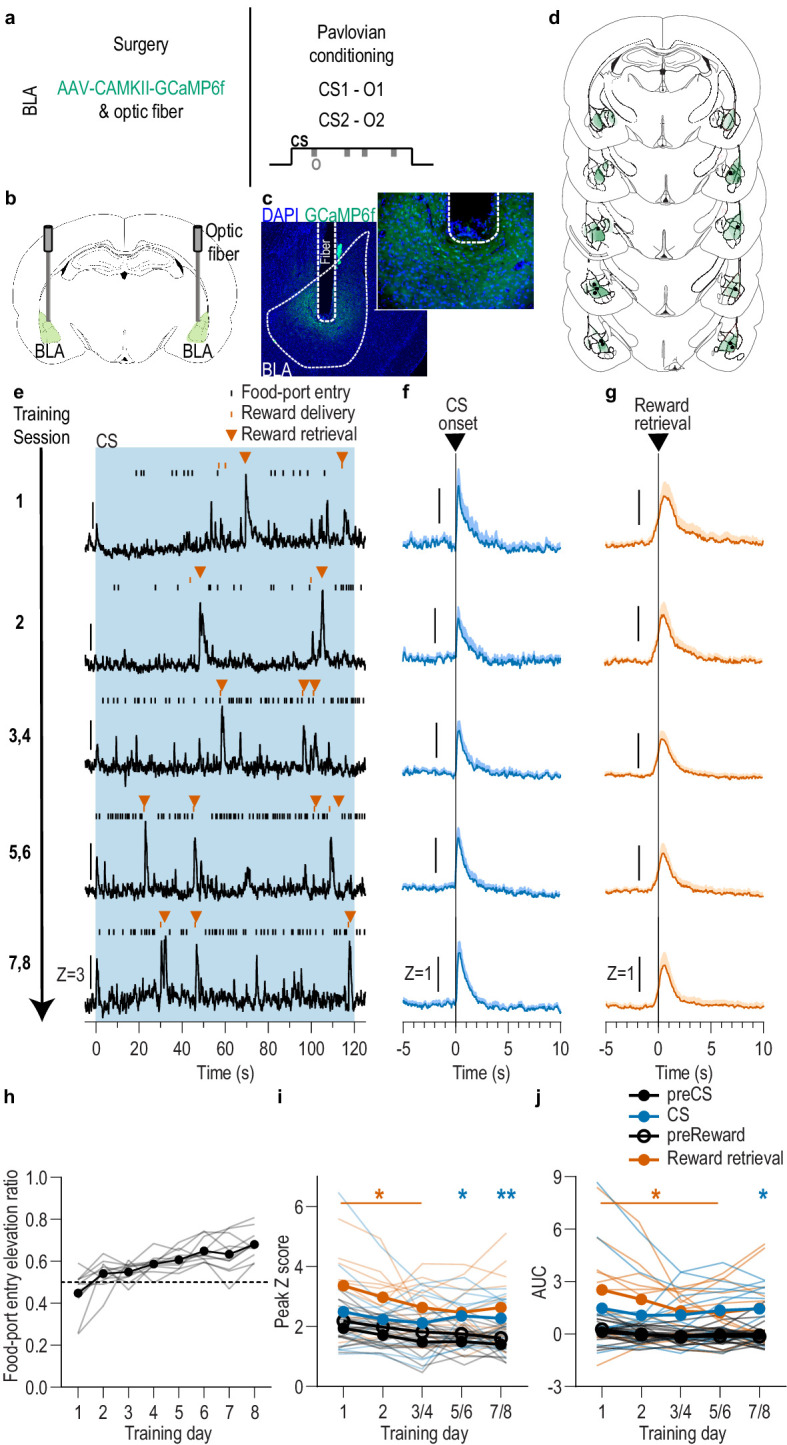
Figure 1—figure supplement 1. Food-port entry rate during Pavlovian conditioning for BLA fiber photometry GCaMP6f imaging experiment.

Figure 1—figure supplement 2. Representative examples of raw GCaMP6f and isosbestic fluorescent changes in response to cue presentation and reward delivery and retrieval across days of training.

Figure 1—figure supplement 3. BLA neurons are activated during stimulus-outcome learning across each of the eight Pavlovian conditioning sessions.

Figure 1—figure supplement 4. BLA reward responses aligned to reward delivery during Pavlovian conditioning.

Figure 1—figure supplement 5. Food-port entries during the CS in the absence of reward do not trigger a BLA response.
