
Figure 2. BLA neurons are only transiently activated by stimuli if they are not paired with reward.
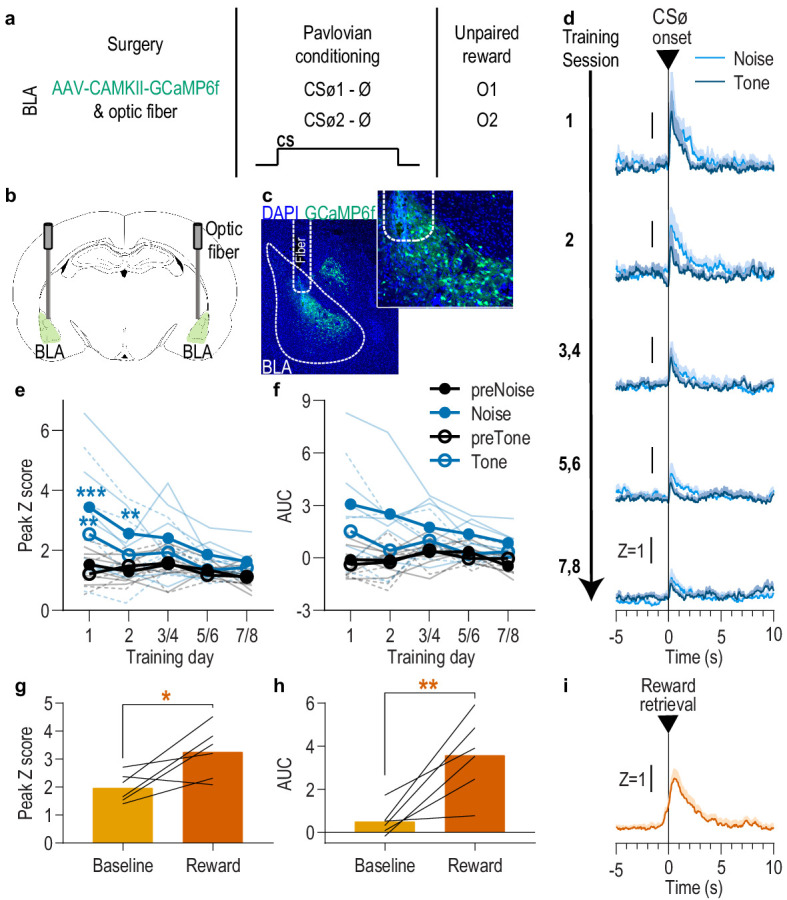
(a). Procedure schematic. CSØ, neutral stimulus; Ø, no reward outcome; O, outcome (sucrose solution or food pellet). (b) Schematic of fiber photometry approach for imaging bulk calcium activity in BLA neurons. (c) Representative fluorescent image of GCaMP6f expression and fiber placement in the BLA. (d) Trial-averaged GCaMP6f fluorescence change (Z-scored ∆F/F) in response to noise and tone CSØ onset across days. Shading reflects between-subjects s.e.m. (e-f) Trial-averaged quantification of maximal (e; peak) and area under the GCaMP Z-scored ∆F/F curve (f; AUC) during the 3 s following noise and tone CSØ onset compared to equivalent baseline periods immediately prior to each event. Thin light lines represent individual subjects (solid = Noise, dashed = Tone). (g-h) Trial-averaged quantification of maximal (g; peak) and area under the GCaMP Z-scored ∆F/F curve (h; AUC) during the 3 s following retrieval of the unpaired reward compared to equivalent baseline period immediately prior reward retrieval. Lines represent individual subjects. (i) Trial-averaged GCaMP6f fluorescence (Z-scored ∆F/F) in response to unpaired reward, averaged across reward type. Shading reflects between-subjects s.e.m. N = 6. *p<0.05, **p<0.01 relative to pre-event baseline. See Figure 2—source data 1.