. 2021 Jun 18;10:e68617. doi: 10.7554/eLife.68617

Figure 5. Serial disconnection of lOFC→BLA projections during stimulus-outcome pairing from BLA→lOFC projections during Pavlovian-to-instrumental transfer test disrupts stimulus-outcome memory.

(a) Procedure schematic. CS, conditional stimulus (white noise or tone); O, outcome (sucrose solution or food pellet); A, action (left or right lever press); CNO, clozapine-n-oxide. (b) Schematic of multiplexed optogenetic/chemogenetic inhibition strategy for unilateral optical inhibition of lOFC→BLA projections during Pavlovian conditioning and contralateral, unilateral, chemogenetic inhibition of BLA→lOFC projections during the PIT test. (c) Top: Representative fluorescent image of bilateral ArchT-eYFP expression in lOFC cells bodies and unilateral expression of hM4Di-mCherry in BLA axons and terminals in the lOFC in the vicinity of implanted guide cannula. Bottom: Representative image of unilateral BLA fiber placement in the vicinity of immunofluorescent ArchT-eYFP expressing lOFC axons and terminals (right) and unilateral expression of hM4Di-mCherry in BLA cell bodies in the contralateral hemisphere (left). (d) Schematic representation of bilateral ArchT-eYFP expression and unilateral cannula placement in lOFC and unilateral hM4Di expression and placement of optical fiber tips in the contralateral BLA for all Contralateral group subjects. Fibers are shown in left and cannula placement in the right hemisphere, but fiber/cannula hemisphere arrangement was counterbalanced across subjects. See Figure 5—figure supplement 1 for histological verification of ipsilateral control. (e) Elevation [(CS probe entry rate)/(CS probe entry rate + preCS entry rate)] in food-port entries during the CS probe period (after CS onset, before first reward delivery), averaged across trials and CSs for each day of Pavlovian conditioning. Thin light lines represent individual subjects (Contralateral eYFP/mCherry (solid lines) and Ipsilateral ArchT/hM4Di (dashed lines) collapsed into a single control group). (f) Elevation in lever presses on the lever that earned the same outcome as the presented CS (Same; [(presses on Same lever during CS)/(presses on Same lever during CS + Same presses during preCS)], averaged across trials and across CSs), relative to the elevation in responding on the alternate lever (Different; [(presses on Different lever during CS)/(presses on Different lever during CS + Different presses during preCS)], averaged across trials and across CSs) during the PIT test. Lines represent individual subjects. (g) Elevation in food-port entries to CS presentation (averaged across trials and CSs) during the PIT test. Data points represent individual subjects, triangles indicate ipsilateral control subjects. Control, N = 16; Contralateral disconnection group, N = 10. **p<0.01. See Figure 5—source data 1.

Figure 5—source data 1. Source data for Figure 5 and Figure 5—figure supplement 12.

Figure 5.

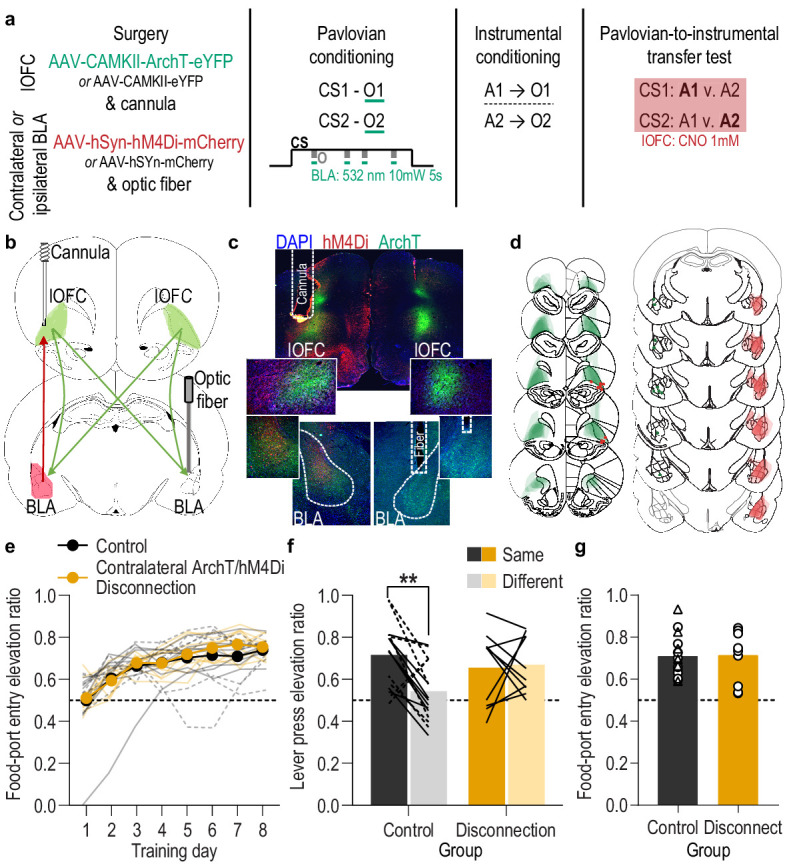
Figure 5—figure supplement 1. Histological verification for unilateral, ipsilateral lOFC→BLA/BLA→lOFC inhibition subjects.

Figure 5—figure supplement 1.

(a) Schematic of multiplexed optogenetic/chemogenetic inhibition strategy for unilateral optical inhibition of lOFC→BLA projections during Pavlovian conditioning and ipsilateral, unilateral, chemogenetic inhibition of BLA→lOFC projections during the PIT test. (b) Top: Representative fluorescent image of ArchT-eYFP expression in lOFC cells bodies and unilateral expression of hM4Di-mCherry in BLA axons and terminals in the lOFC in the vicinity of implanted guide cannula. Bottom: Representative image of fiber placements in the vicinity of immunofluorescent ArchT-eYFP expression in lOFC axons and terminals in the BLA and unilateral expression of hM4Di-mCherry in BLA cell bodies in that same hemisphere. (c) Schematic representation of bilateral ArchT-eYFP expression and unilateral cannula placement in lOFC and unilateral, ipsilateral hM4Di expression and placement of optical fiber tips in BLA for all subjects. All fibers and cannula are shown in left hemisphere, but inhibited hemisphere was counterbalanced across subjects.
Figure 5—figure supplement 2. Food-port entry and press rates during Pavlovian conditioning and PIT test for lOFC→BLA/BLA→lOFC serial disconnection experiment.

Figure 5—figure supplement 2.

(a) Food-port entry rate (entries/min) during CS probe period (after CS onset, before first reward delivery), averaged across trials and CSs for each day of Pavlovian conditioning. There was no effect of unilateral lOFC→BLA inhibition during reward delivery on the development of this Pavlovian conditional goal-approach response in either the disconnection or ipsilateral control group (CS x Training: F(3.4,78.6) = 23.07, p<0.0001; CS: F(1,23) = 131.7, p<0.0001; Virus group: F(2,23) = 1.42, p=0.26; Training: F(3.7,85.4) = 3.95, p=0.007; Virus x Training: F(7.4,85.43) = 2.24, p=0.04; Virus x CS: F(2,23) = 1.19, p=0.32; Virus x Training x CS: F(6.8,78.6) = 1.36, p=0.24). **<0.05, **p<0.01, ***p<0.001, relative to preCS (top, eYFP/mCherry; middle, ipsilateral ArchT/hM4Di; bottom, contralateral ArchT/hM4Di). (b) Lever press rate (presses/min) averaged across levers and across the final 2 days of instrumental conditioning. There was no significant difference in press rate between the control groups and the disconnection group (F(2,23) = 0.30, p=0.75). Circles represent individual subjects. (c). Lever press rate (presses/min) on the lever that earned the same outcome as the presented CS (averaged across trials and across CSs), relative to the press rate on the alternate lever (Different) during the PIT test. Planned comparisons, based on the results detected in Figure 5f, showed that for the contralateral eYFP/mCherry control subjects CS presentation significantly increased responding on the action earning the same reward as that predicted by the presented cue relative to the preCS baseline period (t7 = 3.30, p=0.01). The CSs did not significantly alter responses on the different lever in this group (t7 = 0.58, p=0.58). For the ipsilateral ArchT/hM4Di control subjects, CS presentation increased responding on the Same action relative to both the preCS baseline period (t7 = 3.43, p=0.01) and to the different action during the CS (t7 = 4.51, p=0.003). The CSs also did not significantly alter responses on the different lever in this control group (t7 = 0.67, p=0.52). For the Disconnection (contralateral ArchT/hM4Di) group, the CSs caused a non-discriminate increase in lever pressing relative to the baseline period on both levers (Same: t9 = 2.54, p=0.03; Different: t9 = 3.92, p=0.004). Lines represent individual subjects. (d) Food-port entry rate during CS presentation (averaged across trials and across CSs) during the PIT test. For all groups, CS presentation triggered a similar significant elevation in this goal-approach behavior (CS: F(1,23) = 47.67, p<0.0001; Virus: F(2,23) = 0.86, p=0.44; Virus x CS: F(2,23) = 0.14, p=0.87). Lines represent individual subjects. Contra, contralateral. *p<0.05, **p<0.01, ***p<0.001.