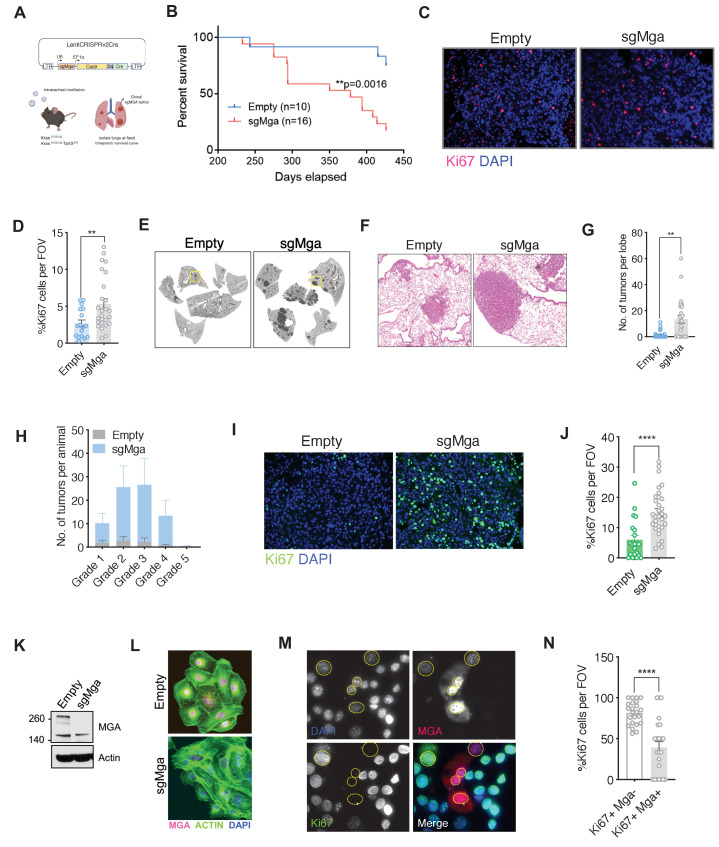
Figure 1. Mga inactivation in vivo leads to accelerated tumorigenesis.
(A) Schematic of lentiCRISPRv2cre vector and strategy used for in vivo Kras (K) and Kras, Tp53 (KP) experiments. (B) Kaplan–Meier curve for survival in sgMga (Cre-Cas9) vs Empty (Cre-Cas9 lacking sgMga) virus-treated Kras mice (p-value computed using Log-rank test). (C) Representative micrographs and (D) quantification of Ki67 immunostaining on lung tumor tissue from Kras-sgMga and Kras empty vector infected control mice (n = 5 mice per group. **p=0.0036. Calculated using Welch’s t-test assuming unequal variance). (E) Representative H and E staining of sgMga and Empty lungs from KP mice harvested 3 months post-intratracheal instillation. (F) Higher magnification of selected regions from (E) showing individual tumors in both groups. (G) Quantification of number of lesions per lobe and (H) number of lesions per grade in Empty (control) and sgMga vector treated animals (n = 5 lung lobes each from five mice per group. **p=0.001). (I) Representative images and (J) quantification of Ki67 staining to assess proliferation in KP Empty (control) and KP-sgMga lung tumors harvested 3 months post-infection (n = 32 tumors from four sgMga mice n = 21 tumors from two Empty (control) mice. ****p<0.0001. Calculated using Welch’s t-test assuming unequal variance). (K) Western blot and (L) immunofluorescent staining for MGA in cell lines derived from KP tumors. (M) Representative images and (N) quantification of Ki67 and MGA co-staining in an sgMga KP line upon ectopic expression of MGA (n = 23 FOV each from three independent experiments. ****p<0.0001). All p-values calculated using a two-sided Student’s t-test unless otherwise noted. Error bars represent SEM.


