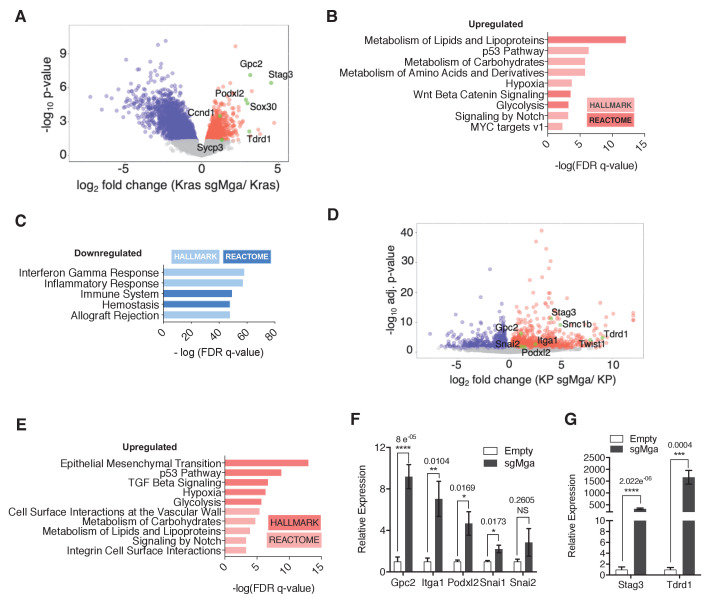
Figure 2. MGA loss leads to the de-repression of PRC1.6 and MYC targets and upregulation of pro-invasion genes.
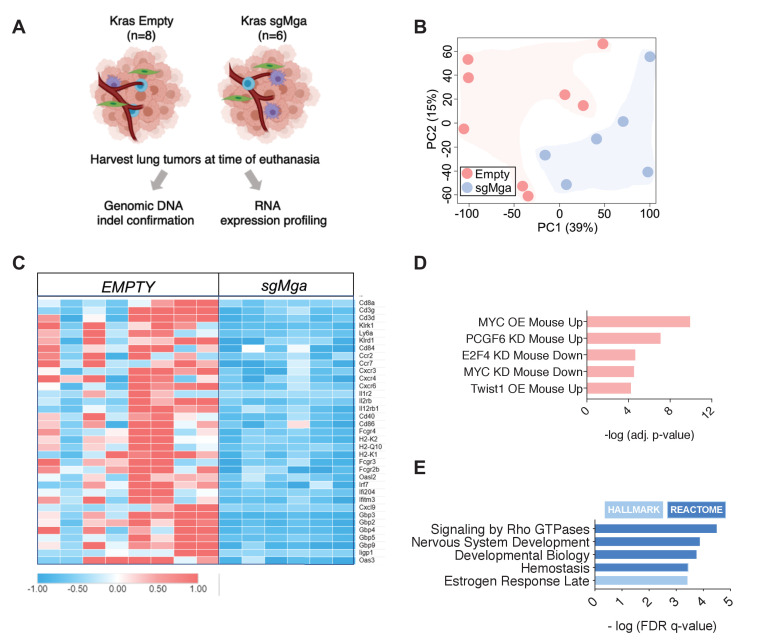
(A) Volcano plot of Kras tumor RNA profiling data comparing Kras and Kras-sgMga tumors (see Figure 1B–D). Upregulated pro-invasion and PRC1.6 targets highlighted in green. (B, C) Hallmark and Reactome GSEA for pathways enriched for in (B) upregulated and (C) downregulated genes in Kras-sgMga tumors compared to Kras empty control tumors. (D) Volcano plot of KP cell line RNA-Seq data showing PRC1.6 and pro-invasive genes in green (n = 2 cell lines in triplicate for KP control and 3 cell lines in triplicate for KP-sgMGA). (E) Hallmark and Reactome analysis of genes upregulated in KP-sgMga vs. control KP empty cell lines. (F, G) qPCR on Empty and sgMga KP lines to confirm levels of (F) pro-invasive and (G) PRC1.6 meiotic targets (n = 6 for each – 2 sets of RNA [biological replicates] from three different lines for sgMga and Empty). p-values for individual genes indicated in figure. All p-values calculated using a two-sided Student’s t-test. Error bars represent SEM.


