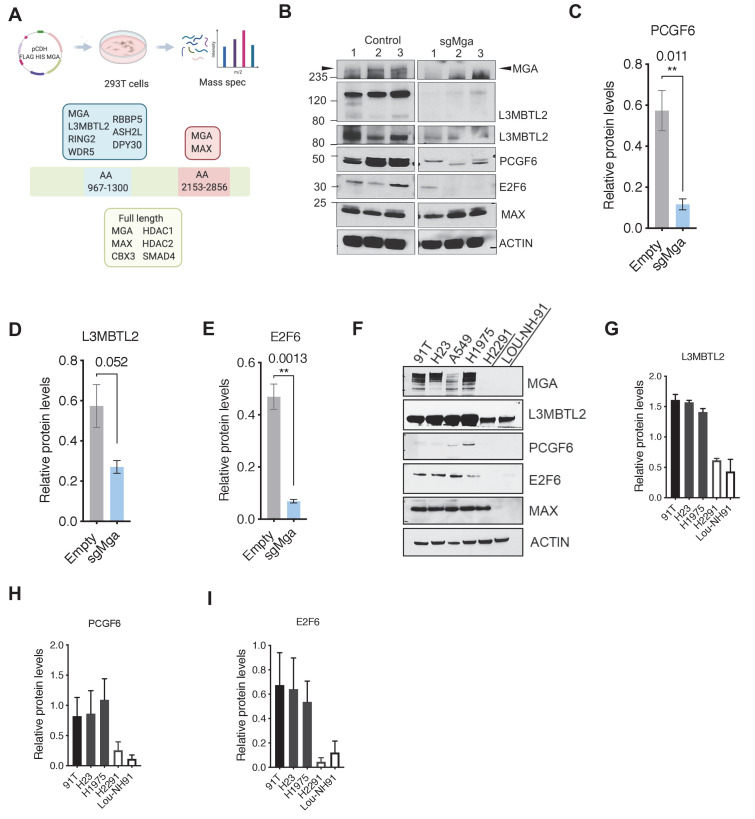
Figure 3. MGA binds and stabilizes PRC1.6 complex members in lung cancer cells.
(A) Mass spectrometric analysis of proteins interacting with FLAG- His-double tagged full-length MGA or isolated aa967–1300 (encompassing the DUF4801 region) and aa2153–2853 (encompassing the bHLHZ domain) segments of MGA. Confirmed interactors shown shaded in color (protein prophet score > 0.9). (B) Representative immunoblot to show protein levels of MGA, L3MBTL2 (lower panel to show L3MBTL2 at higher exposure), PCGF6, E2F6, and MAX in control and sgMga mouse KP lines (n = 3 individual cell lines for control and sgMga). (C–E) Densitometry of indicated PRC1.6 members, in control and sgMGA KP lines. (F) Representative immunoblots for the indicated proteins in MGA WT and mutant human lung adenocarcinoma cell lines. (G–I) Quantification of protein levels of the indicated proteins in MGA WT (blacks bars) vs. MGA mutant (white bars) lung cancer lines. For densitometry, three independent western runs were used for each comparison. Error bars represent SEM.
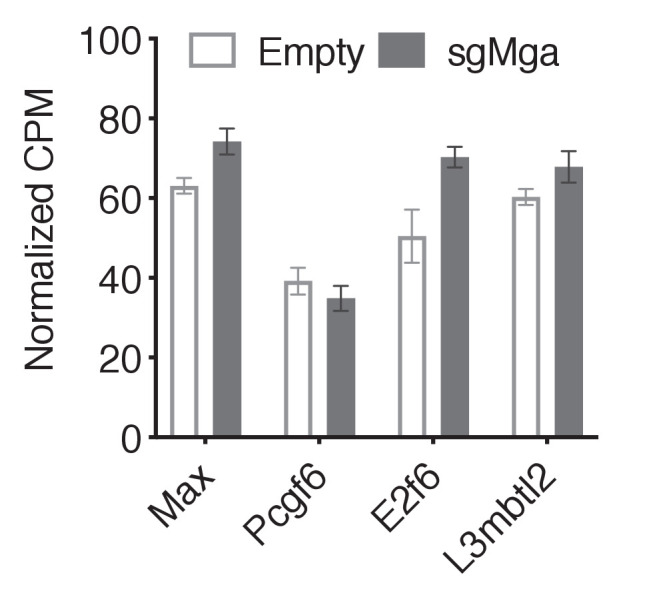
Figure 3—figure supplement 1. PRC1.6 complex member mRNA levels unchanged upon MGA loss in lung cancer cells.


