. 2021 Jul 8;10:e64212. doi: 10.7554/eLife.64212

Figure 5. MGA is essential for PRC1.6 genomic binding in tumor cells.

(A) Venn diagram showing overlap between MAX, MGA, E2F6, and L3MBTL2 bound genes in KP cells. (B) Heatmaps showing genome-wide promoter proximal (±2 kb) binding by the indicated transcription factors in control and sgMga KP cells. (C) Meta-plots of occupancy by the indicated transcription factors in Empty and sgMga KP cells. (D) Volcano plot of differentially expressed genes that are directly bound by MGA (red and blue dots indicate bound genes, up and down as indicated; green dots with labels indicate genes functionally implicated in MGA activity). (E, F) representative tracks for MGA, L3MBTL2, E2F6, MAX, and MYC binding at the (E) Stag3/Gpc2 promoter and (F) Podxl2 loci in KP cells and sgMGA KP cells. (G–I) Meta-plots of RNA pol2 enrichment at the TSS ±2 kb in sgMGA KP cells (red lines) vs KP cells with wild-type MGA (black lines) at (G) MGA-bound genes, (H) genes upregulated, and (I) genes downregulated in sgMGA KP cells. (J–L) Box plots of RNA pol2 peak areas at TSS ±2 kb in KP vs sgMGA KP cells for (J) loci upregulated (p-value=2.1e-07), (K) loci downregulated (p=1.6e-06). The p-values in (J–L) calculated by Welch two sample t-test. (L) Box plots of RNA pol2 peak areas at MYC-bound loci in KP and sgMGA-KP cells (p=8.7e-05). (M) Venn diagram depicting the numbers of genes bound by RNA polymerase II, MYC, and MGA and their extent of overlap in KP cells.

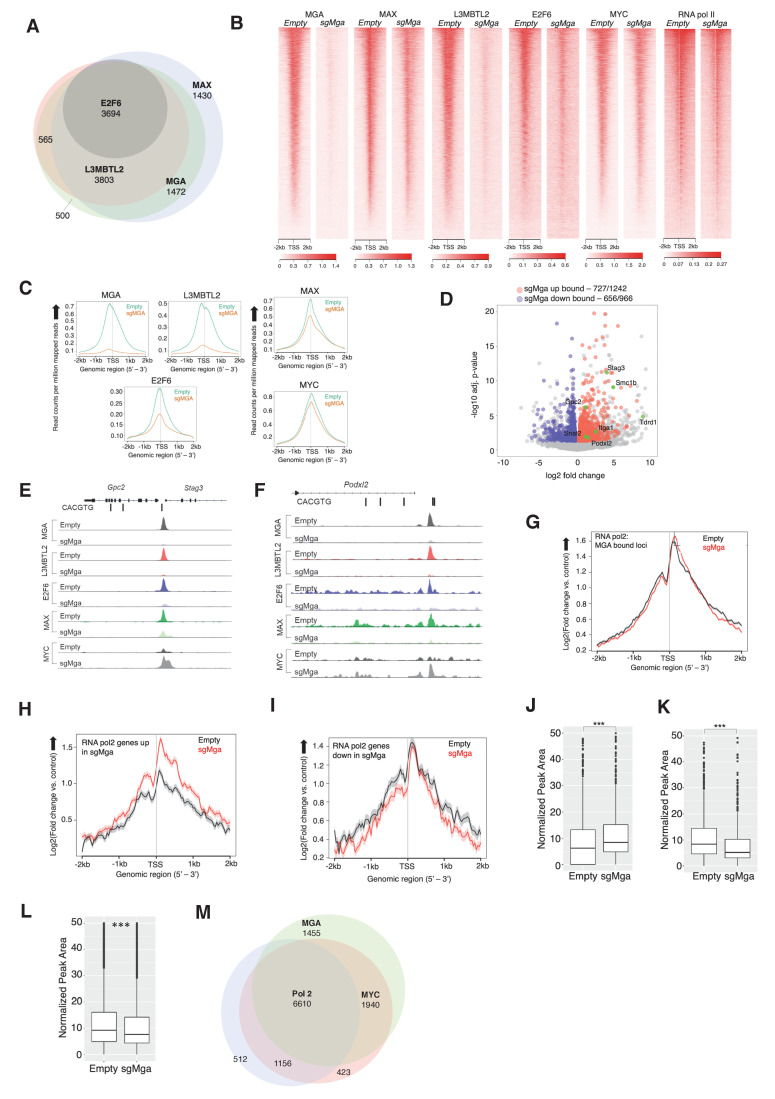
Figure 5.

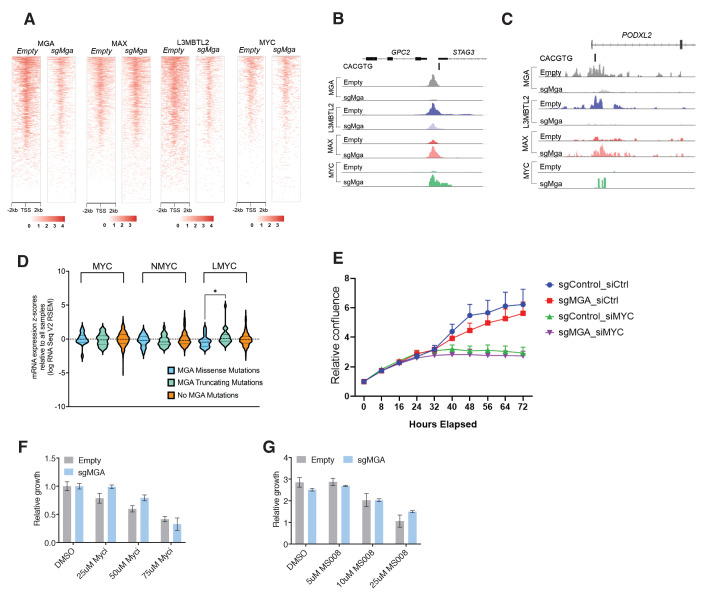
Figure 5—figure supplement 1. MGA, PRC1.6, and MYC binding and activity in human and murine LUAD-derived cells.

Figure 5—figure supplement 1.

(A) Cut and Run generated heatmaps showing genome-wide promoter proximal (±2 kb) binding by the indicated transcription factors in control (empty) and sgMga A549 human LUAD cells. (B, C) Tracks from the indicated genes upregulated by MGA loss: (B) Peaks for MGA, L3MBTL2, MAX, and MYC occupancy at the Stag3/Gpc2 promoter in A549 cells; (C) MGA, L3MBTL2, MAX, and MYC occupancy at the PODXL2 promoter in A549 cells. (D) TCGA data for patient LUADs profiling expression levels for MYC, MYCN, and MYCL in samples containing missense, truncation, or no mutations within MGA (see Materials and methods for details of analysis). (E) Incucyte cell counts over a 72 hr time period following plating of the indicated KP cell lines. Cells were treated with siRNA against MYC (siMYC) or control siRNAs (siCtrl). MGA loss and MYC downregulation were verified by immunoblot. (F) Growth of Control (empty) and sgMGA A549 human LUAD cell line treated with indicated concentrations of the Myc-Max dimerization inhibitor 10058-F4. Growth shown is relative to the DMSO treated control cells (set to 1.0). (G) Growth of A549 tumor cell lines: control (empty) A549 cells and sgMGA-A549 cells treated with MS2-008, a probe that forces MAX homodimerization and blocks MYC-MAX mediated transcription.