. 2021 Jul 8;10:e64212. doi: 10.7554/eLife.64212

Figure 7. MGA loss correlates with activation of STAG3 and PODXL2 in human lung cancer and results in a pro-invasive phenotype in vitro.

(A) Volcano plot of transcripts that are differentially expressed in MGA altered (n = 52) vs. WT (n = 455) from pancancer TCGA lung adenocarcinoma data. Representative genes highlighted in green. (B) Hallmark and Reactome analysis of genes downregulated in MGA altered patients vs. non-altered (p-value cutoff < 0.05). (C) Venn diagram depicting overlap between genes upregulated in the mouse Kras tumor, KP cell line, and Human lung TCGA data with MGA alterations. (D, E) Log ratios of (D) PODXL2 and (E) STAG3 expression in MGA altered vs. WT lung adenocarcinoma patients (TCGA, 2014). (F) Representative wound widths and (G) quantification of wound width at 48 hr in Empty and sgMGA wells (n = 18 Empty, n = 20 sgMGA. ****p=4.77e−05). (H) Spheroid formation and (I) quantification in Empty and sgMGA A549 lines (quantification at Day 6, n = 13 spheroids for each from three independent experiments. ****p=4.89e−11). (J, K) qPCR for (J) PODXL2 and (K) STAG3 expression in Empty and sgMGA A549 cells (n = 4 replicates for each condition). (L) Cell growth upon siRNA knockdown of STAG3 and PODXL2 in A549 Empty and sgMGA cells (n = 3 replicates from three independent experiments for each group). All p-values calculated using a two-sided Student’s t-test unless otherwise noted. Error bars represent SEM.

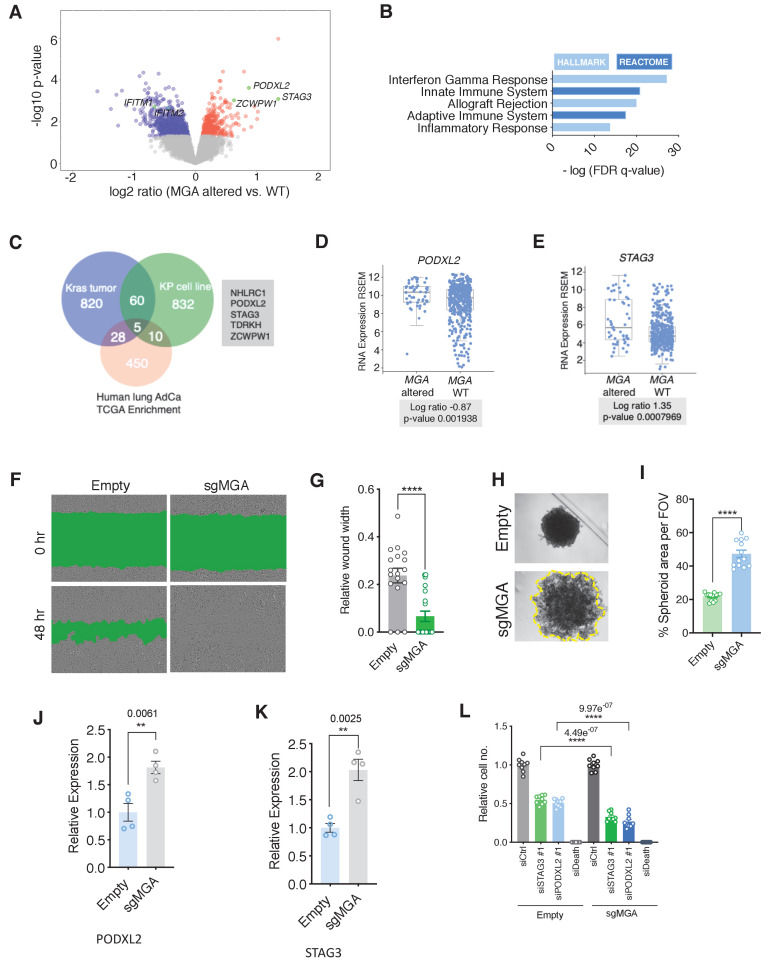
Figure 7—source data 1. MGA loss correlates with activation of STAG3 AND PODXL2 in human lung cancer and results in a pro-invasive phenotype in vitro.
Source data related to Figure 7I,J,K, and L.

Figure 7.

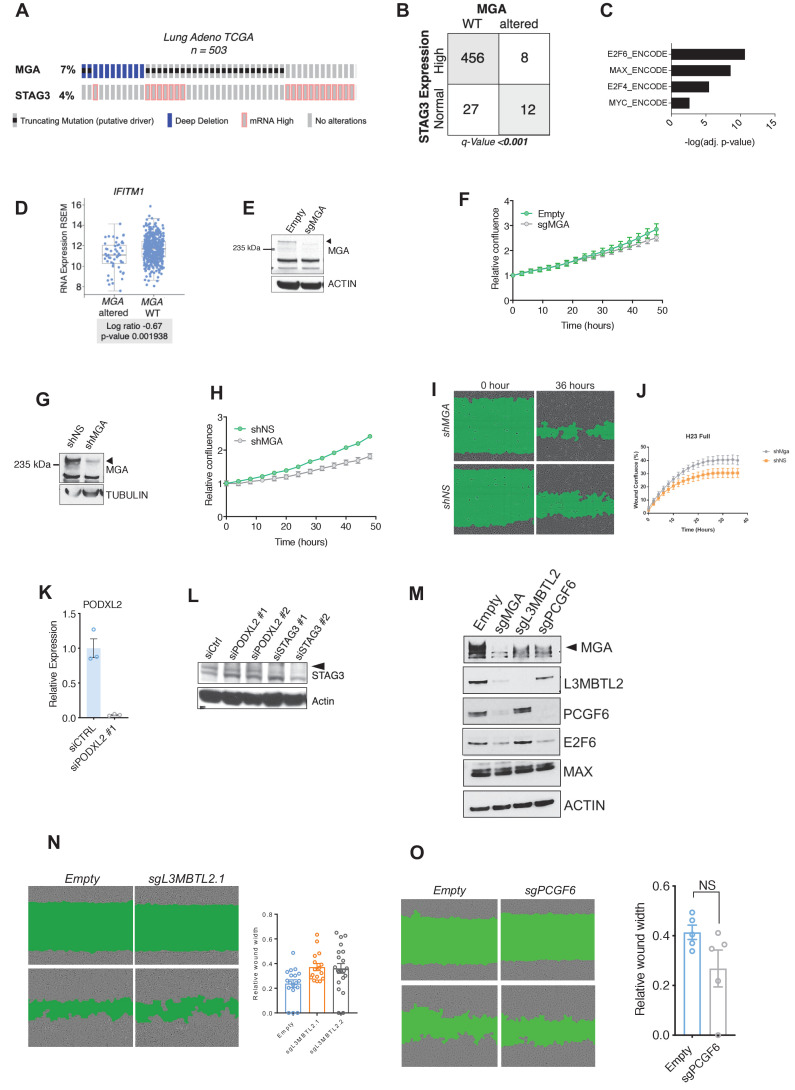
Figure 7—figure supplement 1. Manipulation of MGA in human lung cancer cell lines results in a pro-invasive phenotype and activation of PRC1.6 targets.

Figure 7—figure supplement 1.

(A) Genetic alteration in MGA and expression changes in STAG3 in human lung adenocarcinoma. (B) Co-occurrence of STAG3 ‘mRNA high expression’ and MGA alterations in TCGA lung adenocarcinoma data. (C) ChEA of genes overexpressed in MGA altered cases vs. WT. (D) Expression of IFN signaling gene IFITM1 in MGA altered vs. WT lung adenocarcinoma patients. (E) Immunoblot of MGA levels in sgMGA and Empty vector transduced A549 human lung adenocarcinoma cells. (F) Growth curve of Empty and sgMGA A549 cells cultured in complete media. (G) Immunoblot of MGA levels in control non-silencing shRNA (shNS) and shMGA NCI-H23 lung adenocarcinoma cells. (H) Growth curve of shMGA and non-silencing control NCI-H23 cells. (I) Wound width at 36 hr and (J) kinetics of wound closure in shNS and shMGA transduced NCI-H23 cells. (K) qPCR for PODXL2 in siCTRL vs. siPODXL2#1 transfected A549 Empty cells (n = 3 for each condition). (L) Immunoblot for STAG3 levels in siCTRL, siPODXL2, and siSTAG3 transfected A549 empty cells. All p-values calculated using a two-sided Student’s t-test unless otherwise noted. Error bars represent SEM. (M) Immunoblot for MGA, L3MBTL2, E2F6 and PCGF6 in sgMGA, sgL3MBTL2, sgPCGF6, and control A549 cells. (N) Scratch wound assay comparing sgL3MBTL2 and Empty A549 cells. (O) Scratch wound assays comparing sgPCGF6 and Empty A549 cells. Error bars represent SEM.