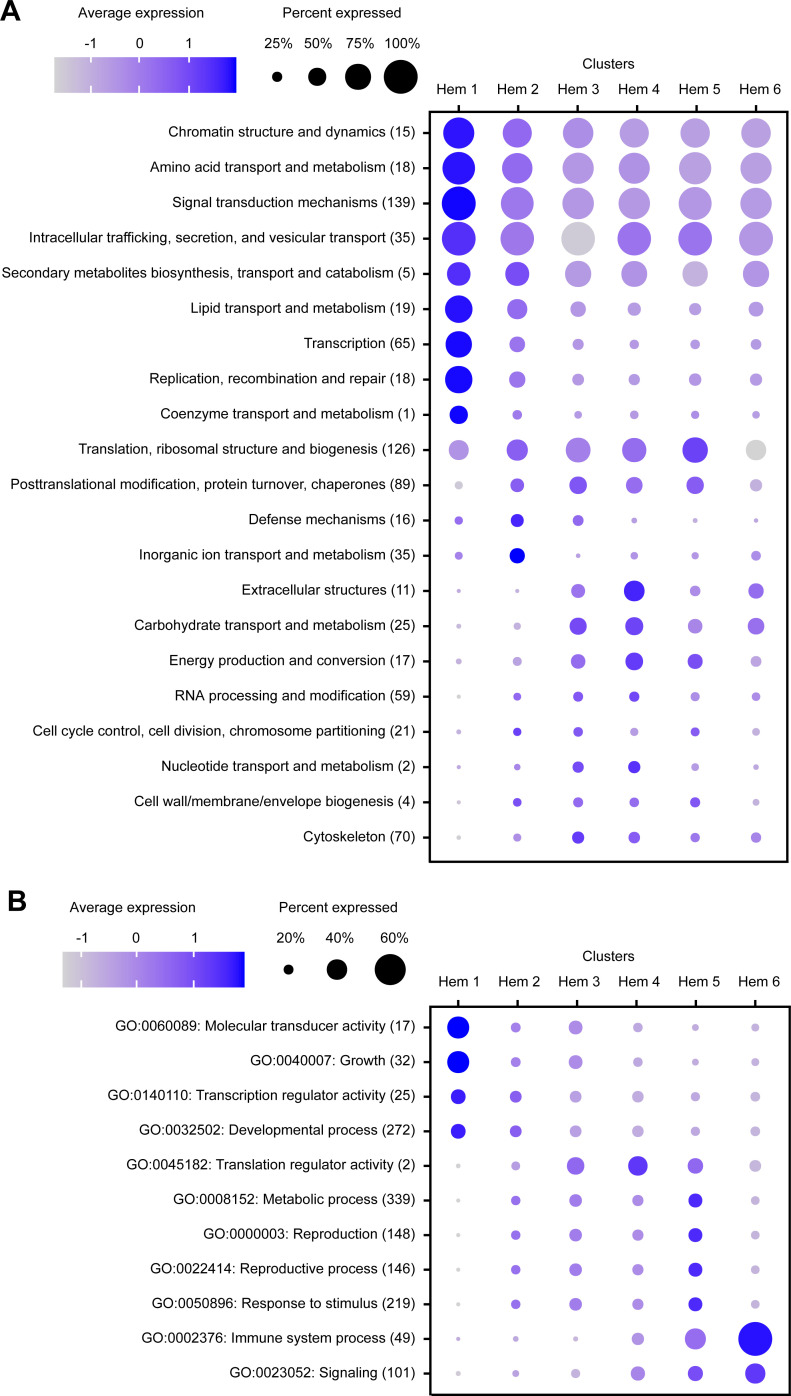
Figure 3. Dot plot profiling of the eukaryotic orthologous group (KOG) and gene ontology (GO) analyses in each cluster.
Dot plot representing the average expression of KOGs (A) and GOs (B) per cluster. Color gradient of dots represents the expression level, while the size represents the percentage of cells expressing any genes per cluster. The numbers in parentheses represent the number of genes estimated as distinct function of KOGs or GOs.

