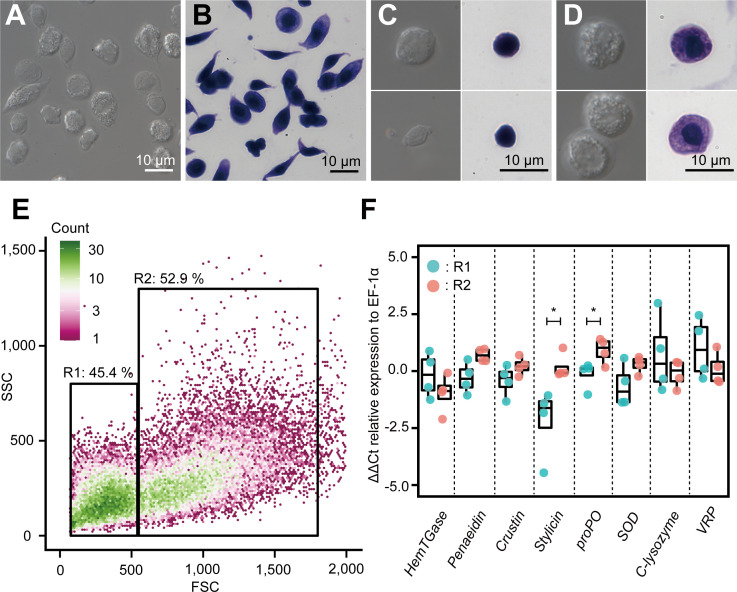
Figure 9. Morphological analysis of hemocytes and transcript profiles based on morphology.
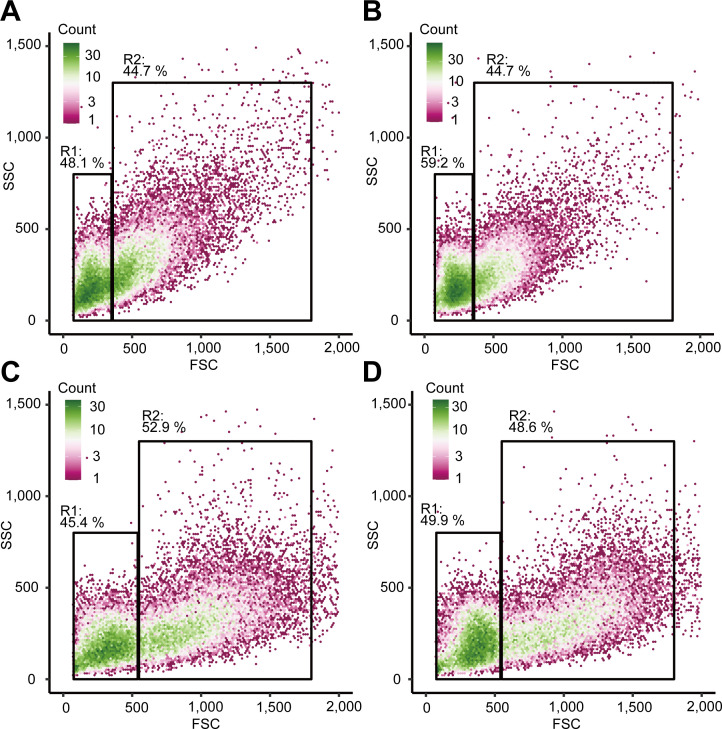
(A) Differential interference contrast (DIC) image of unsorted total hemocytes. (B) Dye-stained total hemocytes. (C) DIC imaging and dye staining of region 1 (R1)-sorted hemocytes. (D) DIC imaging and dye staining of region 2 (R2)-sorted hemocytes. (E) Fluorescence-activated cell sorting (FACS) analysis of hemocytes. Based on the forward scatter (FSC) and side scatter (SSC) two-dimensional space, two regions (R1 and R2) were obtained. (F) Differential gene expression analysis between R1 and R2 of hemocytes sorted using FACS. ∆∆Ct values were analyzed using qRT-PCR. Higher ∆∆Ct values indicate a higher accumulation of mRNA transcripts. The p values shown in the figures are represented by *p<0.05.


