. 2021 Jun 17;10:e69619. doi: 10.7554/eLife.69619

Figure 4. Bdf1/2 participate in recruitment of TFIID and Mediator to chromatin.

(A) Average plots comparing Taf1, Med8, and Spt3 ChEC-seq signals before (dimethyl sulfoxide [DMSO], solid line) and after (indole-3-acetic acid [IAA], dashed line) Bdf1/2 depletion at promoters bound by each factor and classified into TFIID-dependent and coactivator-redundant (CR) categories (2879, 890, and 2526 promoters, respectively). Mean values from replicate experiments are plotted. (B) Boxplot showing log2 change in promoter occupancy of indicated factors after Bdf1/2 depletion. Signals were calculated in a 200 bp window centered on a dominant peak. (C) Average plots comparing Taf1 and Med8 ChEC-seq signals before (DMSO, solid line) and after (IAA, dashed line) Med14 or Taf13 depletion, respectively. Same set of promoters as in (A) was used for this analysis. (D) Boxplot showing log2 change in promoter occupancy of indicated factors after Med14 or Taf13 depletion. Signals were calculated in a 200 bp window centered on a dominant peak. List of Spt3 bound promoters was used to calculate Spt7 occupancy. See also Supplementary file 3.

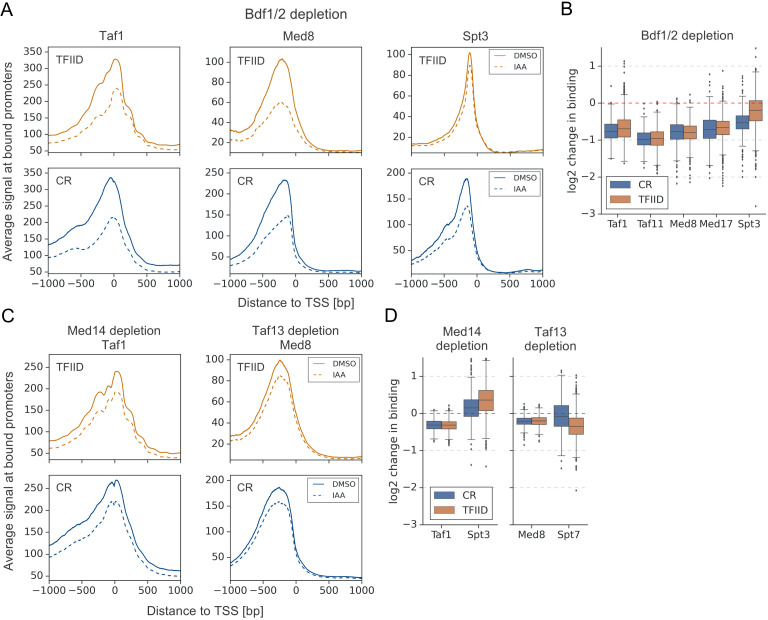
Figure 4.

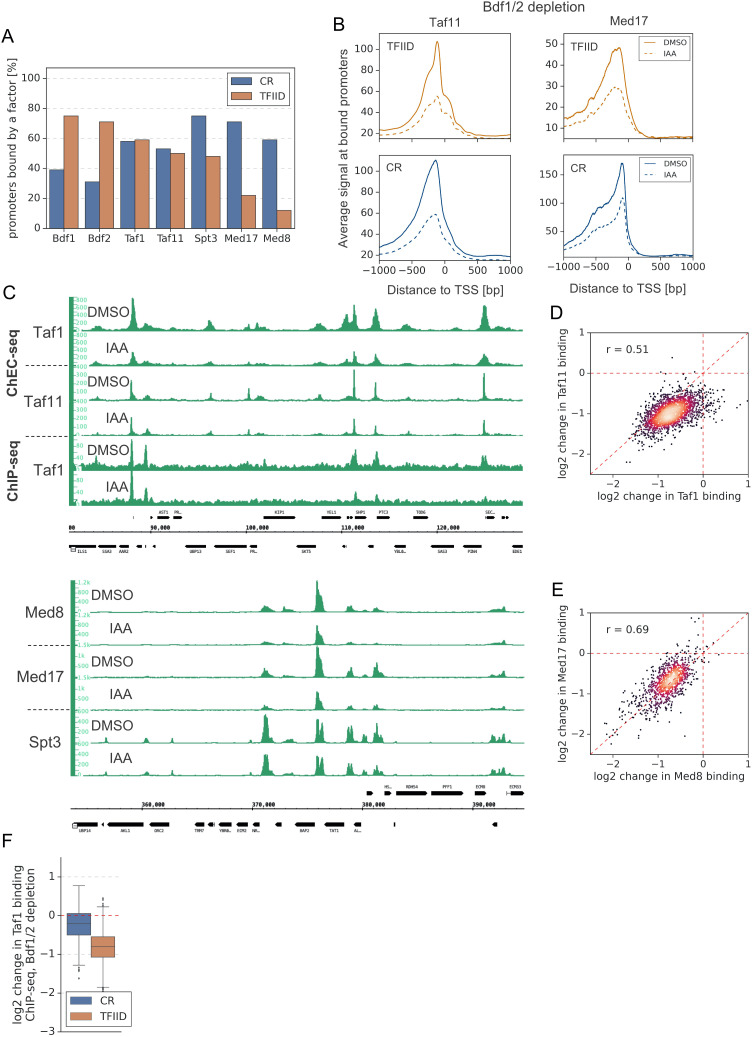
Figure 4—figure supplement 1. Bdf1/2 participate in recruitment of TFIID and Mediator to chromatin.

Figure 4—figure supplement 1.

(A) Bar plot showing percentage of promoters in each class (TFIID-dependent or coactivator-redundant [CR]) bound by a given factor. (B) Average plots comparing Taf11 and Med17 ChEC-seq signals before (dimethyl sulfoxide [DMSO], solid line) and after (indole-3-acetic acid [IAA], dashed line) Bdf1/2 depletion at promoters bound by each factor and classified into TFIID-dependent and CR categories (2486 and 1414, respectively). Mean values from replicate experiments are plotted. (C) Genome browser images showing Taf1 ChEC, Taf11 ChEC, and Taf1 ChIP (upper panel) or Med8 ChEC, Med17 ChEC, and Spt3 ChEC (lower panel) signals at representative genomic locations before (DMSO) and after (IAA) Bdf1/2 depletion. (D) Scatter plot comparing log2 change in binding of Taf1 and Taf11 after depleting Bdf1/2 at 2070 promoters bound by both Taf1 and Taf11. Spearman correlation coefficient (r) is shown. (E) Scatter plot comparing log2 change in binding of Med8 and Med17 after depleting Bdf1/2 at 853 promoters bound by both Med8 and Med17. Spearman correlation coefficient (r) is shown. (F) Boxplot showing log2 change in ChIP-seq promoter occupancy of Taf1 after Bdf1/2 depletion. Signals were calculated in a −100 to 200 bp window relative to transcription start site (TSS) at 2879 promoters defined as bound by Taf1 in ChEC-seq experiments and classified into TFIID-dependent and CR categories.