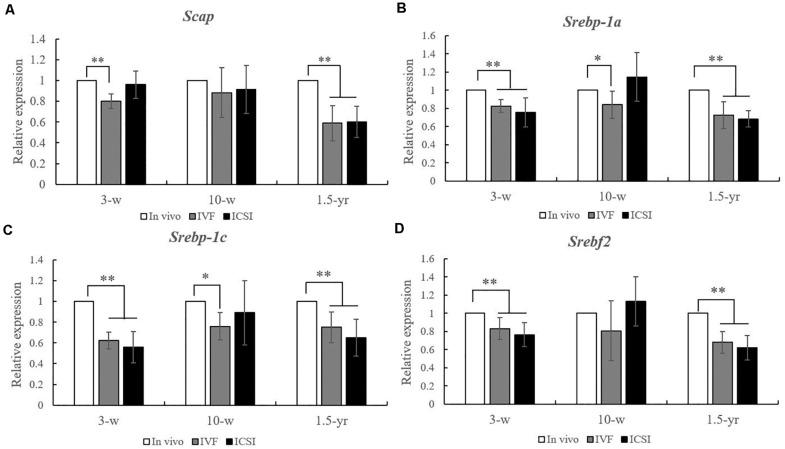
FIGURE 2.
Expression level analysis of Scap, Srebp-1a, Srebp-1c, and Srebf2 mRNA in the lungs from the ICSI, IVF, and in vivo groups (n = 10/group). mRNA expression level analysis at 3, 10 weeks, and 1.5 years of age by real-time quantitative PCR (RT-qPCR). (A) mRNA expression level of Scap. (B) mRNA expression level of Srebp-1a. (C) mRNA expression level of Srebp-1c. (D) mRNA expression level of of Srebf2. The relative expression levels represent the amount of expression normalized to Gapdh expression. Data concerning the relative amount was calculated by the 2–ΔΔCt method. Mean ± SD values are plotted. Between-group comparisons were made by one-way analysis of variance (ANOVA). *P < 0.05, **P < 0.01. 3-w, 3 weeks; 10-w, 10 weeks; 1.5-yr, 1.5 years old.

