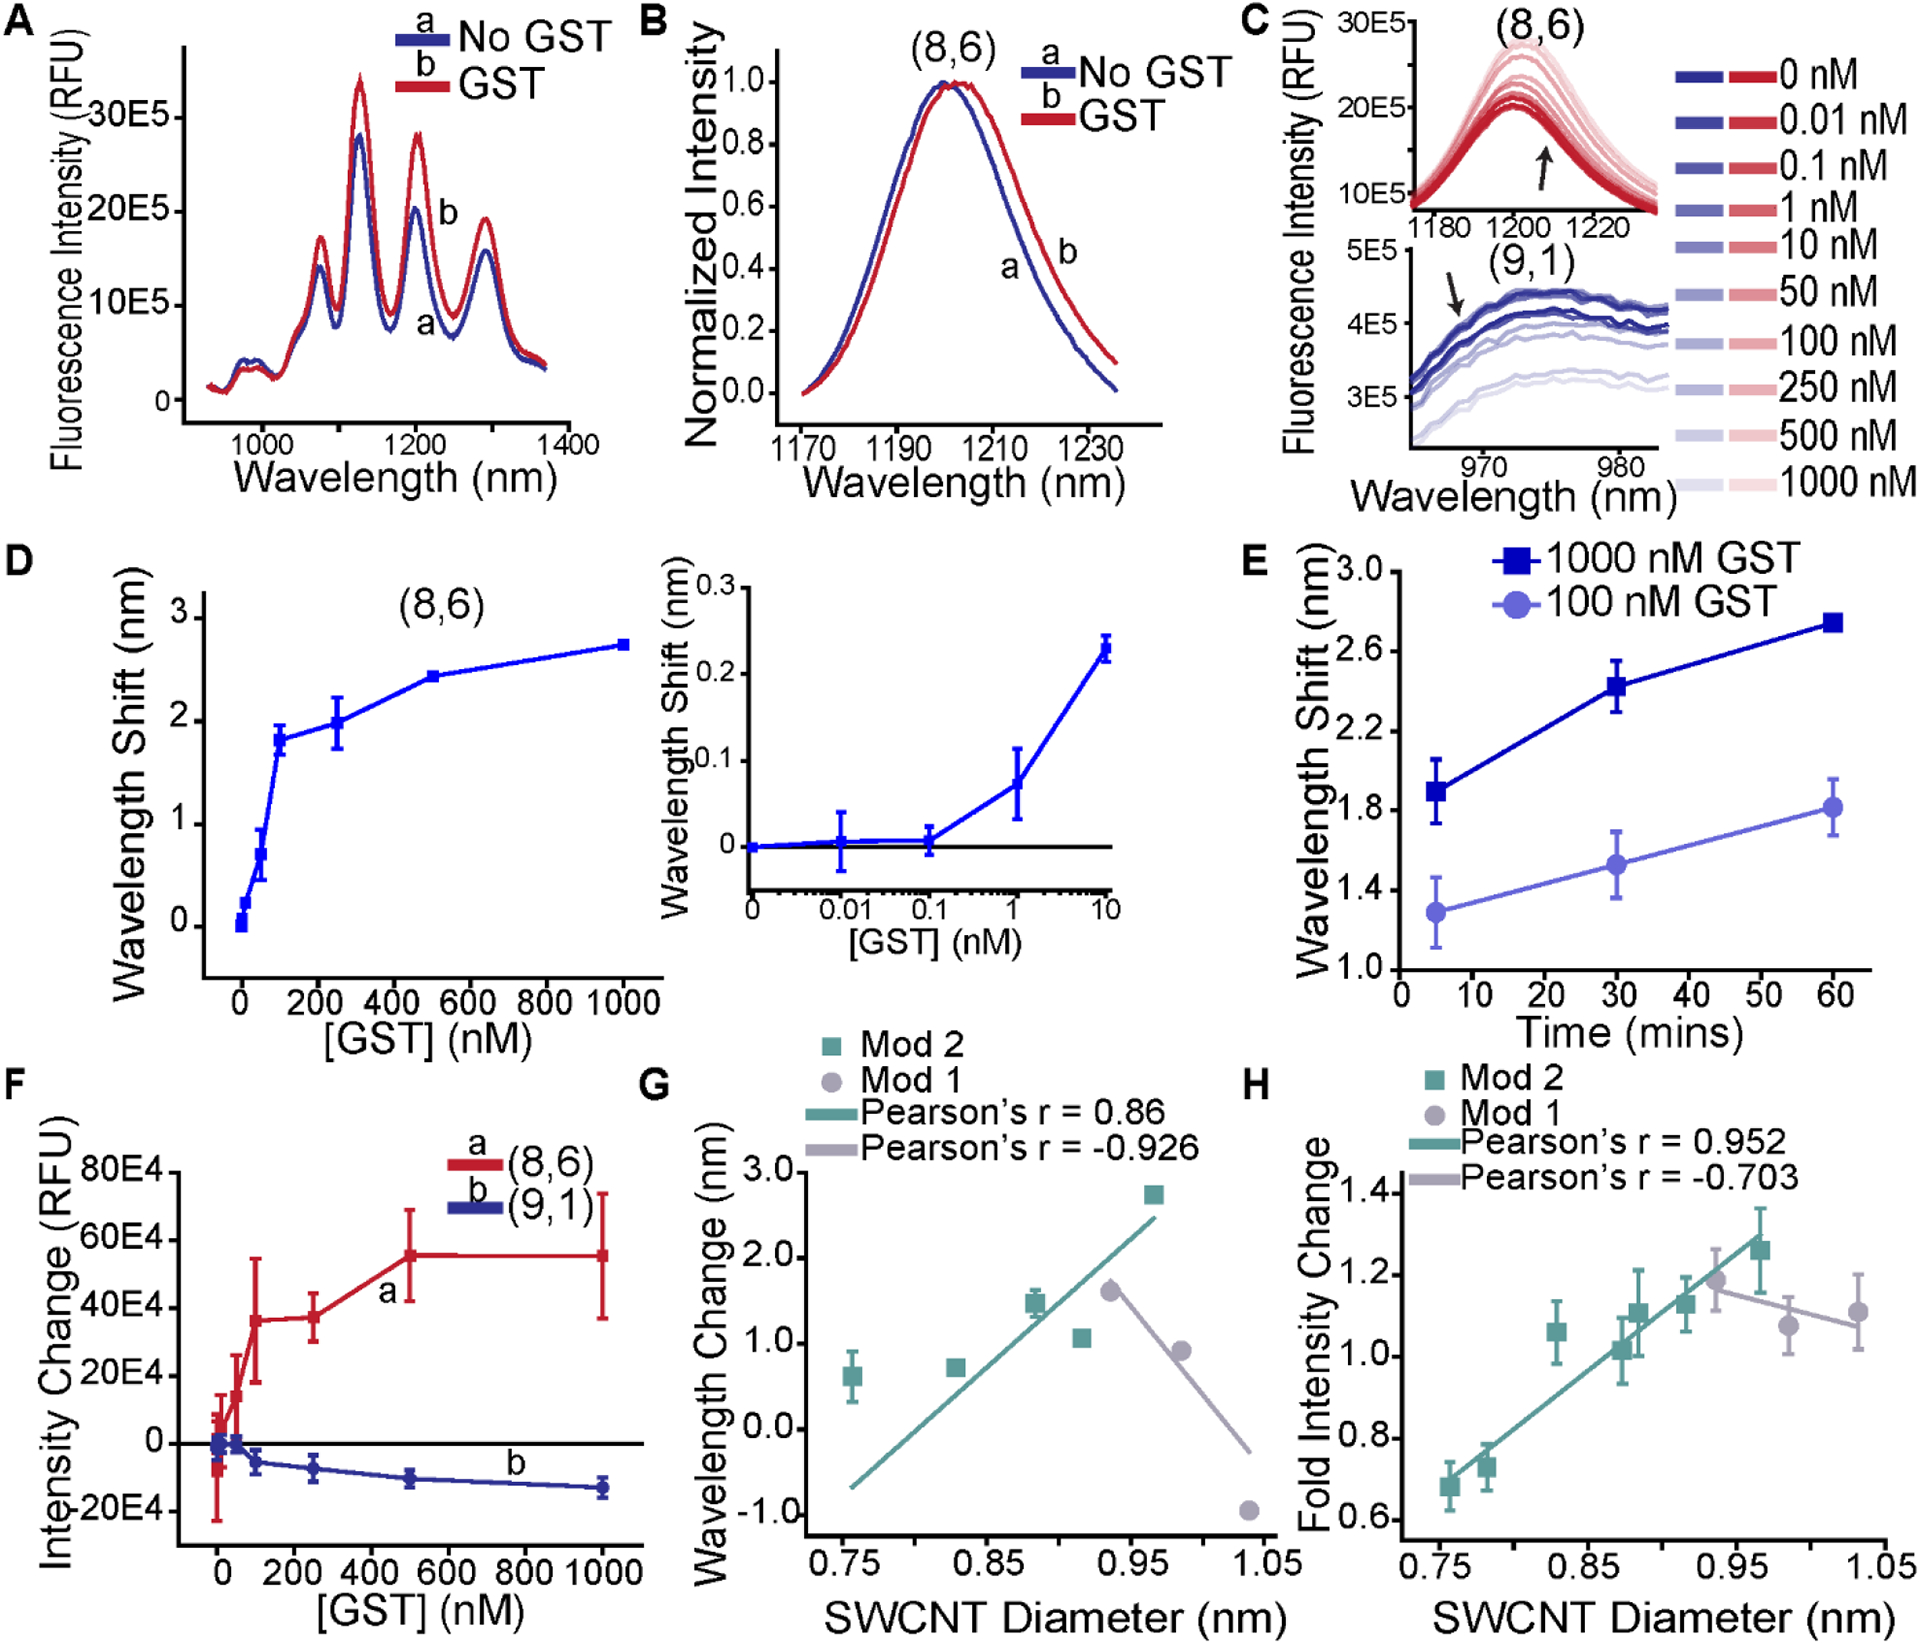
Figure 2. Response of GSH-DNA-SWCNT complexes to GST.

(a) Representative photoluminescence spectrum of the GSH-DNA-SWCNT complexes in the presence of 1000 nM GST, upon excitation at 730 nm. (b) Representative normalized intensity spectra (0 = minimum, 1 = maximum) of the (8,6) nanotube chirality without and with 1000 nM GST upon excitation at 730 nm to illuminate the bathochromic shift. (c) Representative emission spectra of the (8,6) chirality (top) and (9,1) chirality (bottom) for each concentration of added GST. (d) Change in emission center wavelength of the (8,6) chirality as a function of GST concentration. Inset (right): Magnified low-concentration regime of (8,6) response to GST to illuminate the lower range of sensitivity. (e) Temporal response in (8,6) center wavelength in response to maximum (1000 nM) or plateau (100 nM) concentrations of GST. All points d-e represent mean (n = 3 separate samples) ± SD. (f) Photoluminescence intensity change for the (8,6) and (9,1) chiralities as a function of added GST concentration. (g) Wavelength change for each nanotube chirality as a function of chiral diameter. (h) Intensity change for each chirality as a function of chiral diameter. Each point is mean (n = 3 separate samples) ± SD.
